 Context Analytics had a busy 2023. We added functionality to existing products and released new products. We processed over half a billion Tweets, over 60 million Stock Twits messages, and over a million corporate filings from nearly 200 countries. We created new visuals to make relationships between conversations more clear and provided new ways to search and alert on documents. We enhanced our infrastructure and APIs. All while providing the best customer support in the business. If you’re a customer, thank you. If you have looked at our data in the past or are thinking about textual data for this coming year, please contactUS@ContextAnalytics-AI.com. Either way, please enjoy the below summary of Context Analytics year.
Social, Twitter, and StockTwits Oh My!
The US Equity market rebounded in 2023 after its worst-performing year in a decade in 2022. In 2023, the S&P 500 is up 23% with technology stocks leading the drive. When removing overnight market movements, the S&P 500 is up 18.5% on the year.
Messages from Twitter have been predictive a source of subsequent market movements. Using Context Analytics’ Natural Language Processing, Twitter messages are read and scored on sentiment. The S-Factor feed aggregates these message sentiment scores and creates standardized factors by security. One of those factors, the S-Score, is a measure of Twitter Sentiment which is predictive of security price movement intraday out to 2-3 days.
Below is a portfolio, rebalanced daily, that trades securities from market open to market close. Securities with an S-Score >=2 before market open are in the Longs portfolio. These securities have abnormally high sentiment on Twitter. On the other side, securities with a S-Score =< -2 before market open are in the Shorts portfolio and have abnormally low sentiment. Securities are equally weighted within each portfolio, and the Long/Short is an equally weighted combination of the two portfolios.
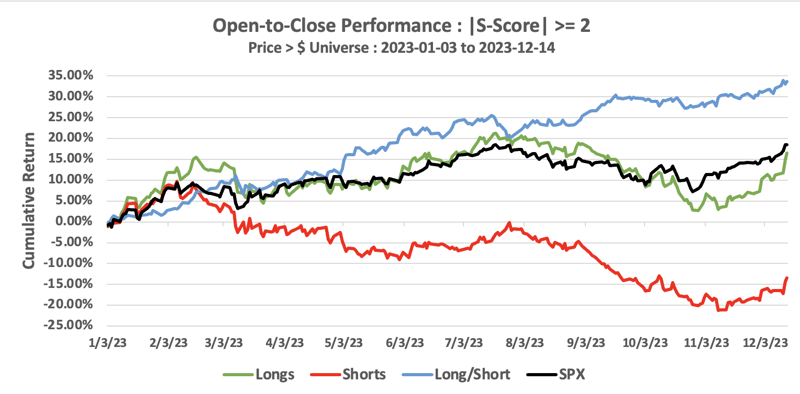
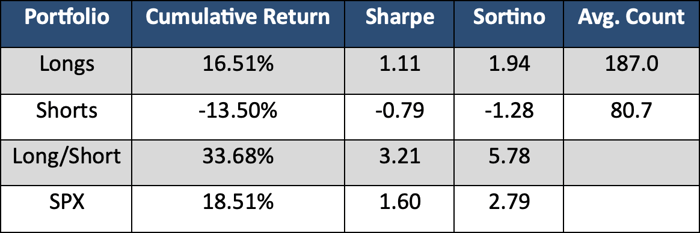
This portfolio looks at all securities with an S-Score in the Price >$5 Universe (3000+ securities). While the Longs portfolio doesn’t outperform the market benchmark, the Long/Short portfolio vastly outperforms. The Long/Short has gained 33% YTD with a Sharpe ratio of 3.21. That outperforms the benchmark by 15% and doubles the Sharpe ratio of the S&P 500. The Longs portfolio on average contained 187 securities each day while the Shorts had an average of 80.7.
This is one of many ways to leverage S-Factor data into market strategies. Above is an example of a market-neutral portfolio that not only reduces risk but enhances returns. Whether the market is booming or faltering, Social Sentiment is an important data point in-stock selection.

Well, this is interesting...
In our research this year, we expanded our focus beyond the analysis of 10-Q and 10-K filings, placing a larger emphasis on 8-K filings. The 8-K forms, or current reports, are filed by publicly traded companies to notify the Securities and Exchange Commission (SEC) and shareholders of major events that may be of importance to investors. These filings cover a wide range of topics, including corporate developments, executive changes, and financial results. The significance of 8-K filings lies in their timely disclosure of critical information that can have a direct impact on a company's stock price and overall financial health.
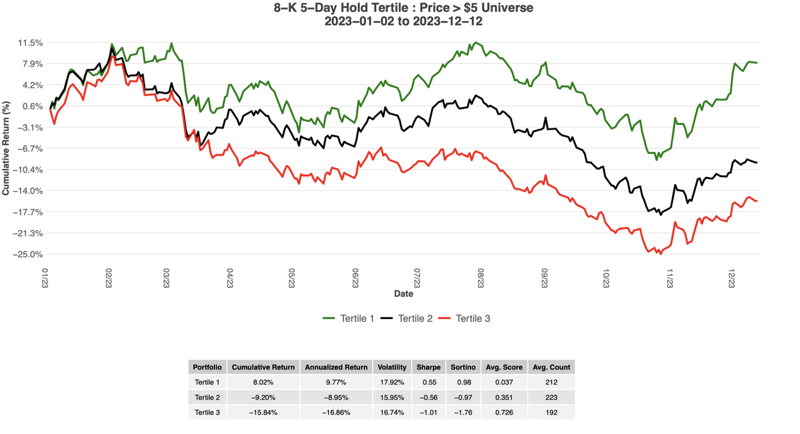
Our most intriguing research in the past year delved into the language used within 8-K filings, specifically focusing on the negative language employed and its subsequent correlation with market returns. To quantify negativity, we developed a metric known as the negativity ratio, calculated as the Negative Hit count divided by the Total hit count, where a hit represents a negative word or phrase. By categorizing companies into tertiles based on their negativity ratios and holding onto the securities for a standardized 5-day period to compound returns, we identified a significant correlation. Companies with higher negativity ratios in their filings were consistently associated with lower subsequent market returns, while those with lower negativity ratios exhibited higher returns. In the year 2023, our research demonstrated a remarkable performance differential, with the lowest tertile of negativity outperforming the middle tertile by 17% and the top tertile by an even more substantial 23%. This finding underscores the tangible impact of language in 8-K filings on market dynamics and investor sentiment.
A Special Shoutout!
This year we have highlighted the functionality of our Unstructured Data Terminal (UDT).
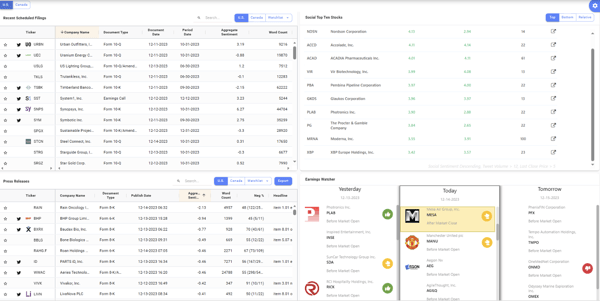
The UDT dashboard is a user-friendly interface that provides various display options customized for individual preferences. Dashboard offers more than seven dedicated widgets focusing solely on sentiment analysis, providing valuable insights into investor sentiment and market trends.
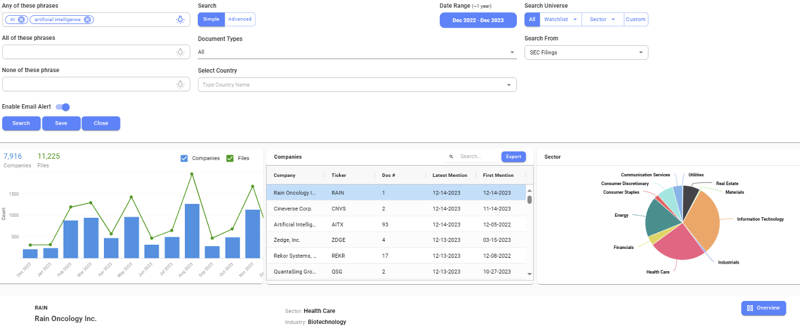
The ThemeX tool offers users the ability to search for specific words and phrases within corporate filings for a specified time range. The output gives users a detailed overview of the number of companies, filings, and distribution of sectors that reference the words and phrases mentioned. Users can then investigate specific company’s documents and see their words and phrases highlighted within the file. Users can also set up email alerts for their saved ThemeX searches to stay informed in real-time.
The Grid page provides a comprehensive repository for US, Canada, and global corporate filings for 14 document types. Users can create custom alerts and watchlists for companies. Within the Grid page, users can filter on columns and customize their layout by creating Screens. Users can also search for a company to see an overview of all the documents they have published. The Comparison page gives a side-by-side of a company’s current and previous 10-K or 10-Q, so users can see all the textual differences in the complete document, or filter on the risk, notes, or MD&A sections. Lastly, users can view a company’s historical sentiment trends overlaid with its closing price, along with an array of social sentiment metrics and popular tweets that are influencing its sentiment.

New Product Alert
In September, we released CAPE (Context Analytics Pitchdeck Extractor). CAPE centralizes financial data from documents in Investor Data Rooms such as Pitch Decks, P&L Statements, and more. CAPE saves Venture Capital and Private Equity firms time from the manual process of pulling out key financial series from these documents. CAPE allows firms to have more time to evaluate, plot, analyze, and forecast potential investments.
Our Automated Document Processing now covers Excel, PDFs, PowerPoints, HTML, and XML Documents. We also convert text, tables, charts, and metrics into centralized JSON, CSVs, and Excel. Currently, we process documents for Hedge Funds, Brokers, Investment Banks, VC, and PE firms, but our universal document processor covers almost any document library your company may have.

Keep an Eye Out!
 In 2023, we worked on our first news-based product, the Quantitative News Feed. News articles are sourced from over 4,000 sources worldwide, fed through CA’s Natural Language Processing engine, and turned into an enriched machine-readable data feed.
The News feed identifies securities being discussed in the articles, offers sentiment analysis on the news article, and also provides contextual analysis by providing the topics being discussed in the article, whether it be Mergers & Acquisitions, Bankruptcy, Analyst Ratings change, etc.
CA’s News feed is available in a JSON API, as well as a front-end display to provide actionable insights, help investment decision-making, and mitigate risk exposure.
If You Haven't Heard.
In our pursuit of technological innovation, three key AI projects are poised to revolutionize our financial data science landscape in the coming year. First, we are investing in dynamic document parsing using Large Language Models (LLM), harnessing the power of advanced natural language processing to extract nuanced information from diverse financial documents. This initiative aims to significantly enhance our ability to analyze and interpret complex textual data including tables, charts, and scanned images, thereby improving the accuracy of our extraction.
Second, we are delving into dynamic unsupervised topic clustering on Social Media, employing state-of-the-art machine learning techniques to categorize and analyze real-time social media discussions related to financial markets. This project not only allows us to capture emerging trends but also provides valuable insights into market sentiment, enabling more agile decision-making for our clients.
Lastly, our focus extends to tracking trends in Securities and Exchange Commission (SEC) filings. By applying sophisticated data analytics and machine learning algorithms, we aim to discern patterns and anomalies within SEC filings, providing our clients with a comprehensive understanding of regulatory landscapes and potential market shifts. These three projects collectively underscore our commitment to leveraging AI for unparalleled insights, reinforcing our position as a pioneer in financial data science.

We aren't done, but it's been fun!
We hope that 2024 will be just as exciting and productive as 2023! A huge thank you to all of our partners and customers for making it such an amazing year. Please reach out with any questions, or just to catch up! We would love to hear from you!
Cheers,
Your friends at Context Analytics