Context Analytics is at the forefront of transforming unstructured financial data into actionable insights for investors and risk managers. We extract information from a diverse set of data sources, including machine-readable filings, environmental, social and governance (ESG) data, earnings transcripts, news articles, and social media sentiment from platforms like Twitter (X) and StockTwits. Our platform seamlessly integrates all these sources to provide a unified and user-friendly dashboard known as the Unstructured Data Terminal (UDT).
The UDT innovative platform is designed to enhance the flow of information from unique sources, providing a comprehensive view for users seeking valuable insights. Through extensive research, Context Analytics has demonstrated that each of these data sources possesses predictive capabilities for market movements. Explore our insightful research and findings on our blog HERE. This blog aims to delve into the various features and tools offered by the UDT, showcasing how it significantly enhances daily market intelligence.
Dashboard page
The UDT provides users with a dynamic and customizable experience from the moment they log in. The dashboard serves as a centralized hub, offering a range of display options tailored to individual preferences. With a user-friendly interface, individuals can personalize their dashboard to suit their specific needs and stay informed in real-time. Among the plethora of widgets available, over seven are dedicated to sentiment analysis, allowing users to gain valuable insights into market trends and investor sentiment.
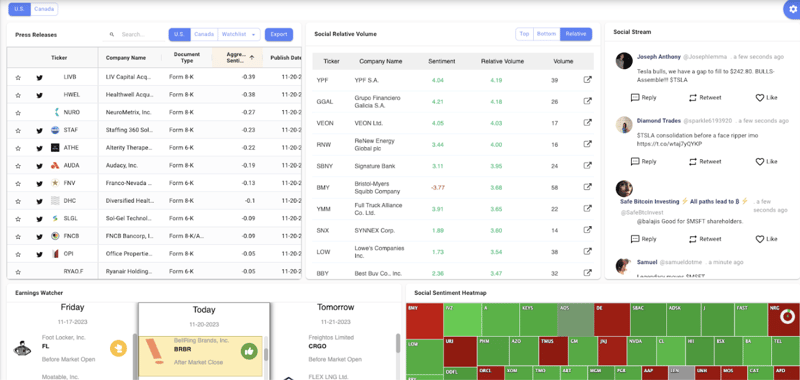
In this personalized dashboard example, five sentiment-based widgets are prominently displayed. The Press Release Widget provides a comprehensive overview of all 8-Ks released in the past 36 hours, accompanied by sentiment metrics. This empowers users to quickly assess the impact of recent announcements on market sentiment.
The Social Relative Volume Widget showcases companies trending on Twitter, offering insights based on both volume and sentiment. Users can stay ahead of the curve by monitoring social media discussions surrounding their chosen stocks in real-time through the Social Scream Widget. Meanwhile, the Earnings Watcher Widget keeps users informed about companies releasing earnings on the current day, the previous day, or the following day, complete with sentiment indicators derived from earnings call transcripts. Finally, the Social Sentiment Heatmap provides a visually intuitive representation of current sentiment for various companies, proportional to their relative Twitter volume. With this array of sentiment-based widgets, the UDT empowers users with a comprehensive and customizable toolset to navigate the complexities of the financial landscape.
Social Sentiment
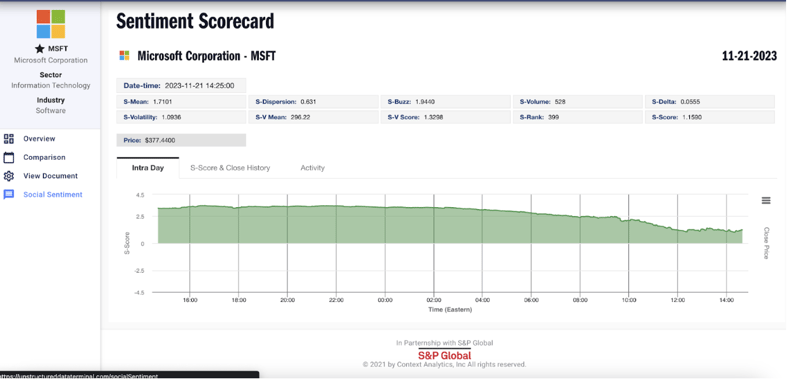
UDT also provides access to a rich array of social sentiment metrics and trends for all securities. The Sentiment Scorecard within the UDT offers a comprehensive view of our patented S-Factors, encompassing various measures of Twitter sentiment. These factors include standardized/raw volume, standardized/raw sentiment score, dispersion, and more.
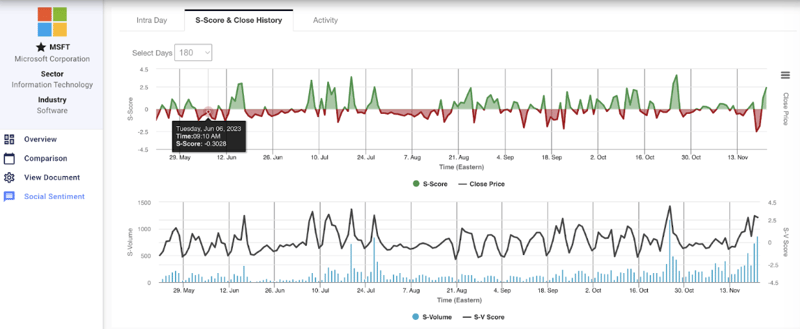
One of the standout features is the ability to showcase historical sentiment trends overlaid with the security’s closing price. This visual representation enables users to identify correlations between social sentiment and market movements, facilitating a more holistic analysis of a security’s performance.
UDT goes beyond quantitative metrics by qualitative dimension to social sentiment analysis. Users can explore the popular tweets influencing sentiment, gaining a nuanced understanding of the conversations shaping market perceptions. This feature enhances the tool’s utility for investors and analysts seeking to gauge the impact of specific events or discussions on a security’s sentiment. 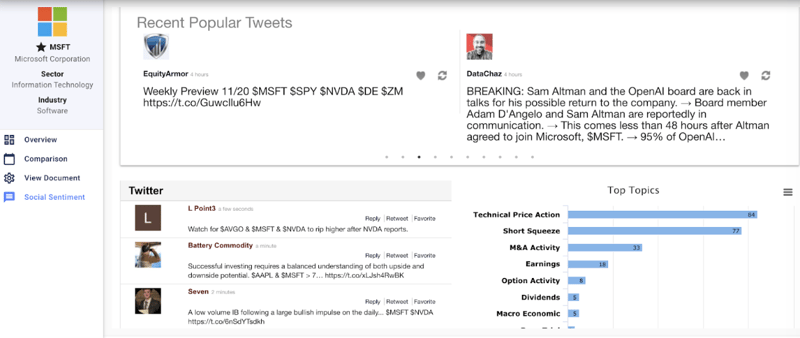
Moreover, the UDT offers a live social stream, allowing users to stay abreast of real-time discussions. The proprietary topic classification further refines this experience, categorizing and highlighting topics being discussed in the social sphere. This feature enables users to quickly identify and focus on the most relevant and impactful discussions, streamlining the process of extracting actionable insights from social sentiment data.
Grid View
The Grid Page serves as the central location for all SEC filings, offering users a comprehensive and organized repository of financial documents. Users can customize their view based on region of interest, with options to focus on filings from the United States, Canada, or a global perspective. The flexibility extends to the file types displayed, allowing users to select from a range of options, including 10-Q, 10-K, 20-F, 40-F, 6-K, 8-K, earnings call transcripts, and ESG (Environmental, Social, and Governance) reports.
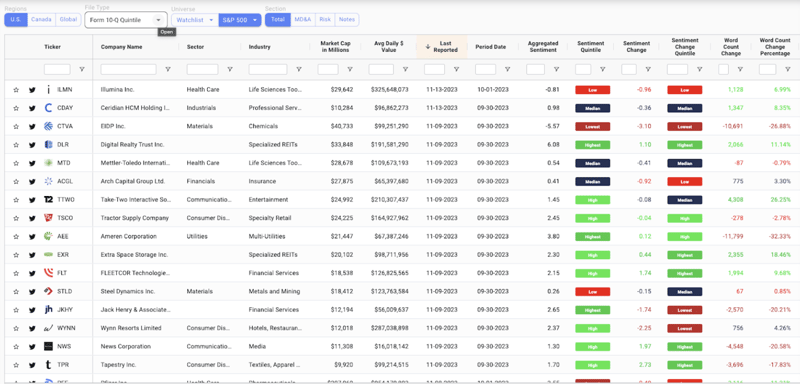
One of the standout features of the Grid Page is its ability to showcase the full history of selected filings alongside corresponding sentiment analysis. For consistent documents such as 10-Q and 10-K, users can delve into sentiment changes and metrics for each company compared to their previous filing. This example view provides a quick overview of shifts in sentiment and word count, aiding users in identifying key trends and changes in corporate disclosures.
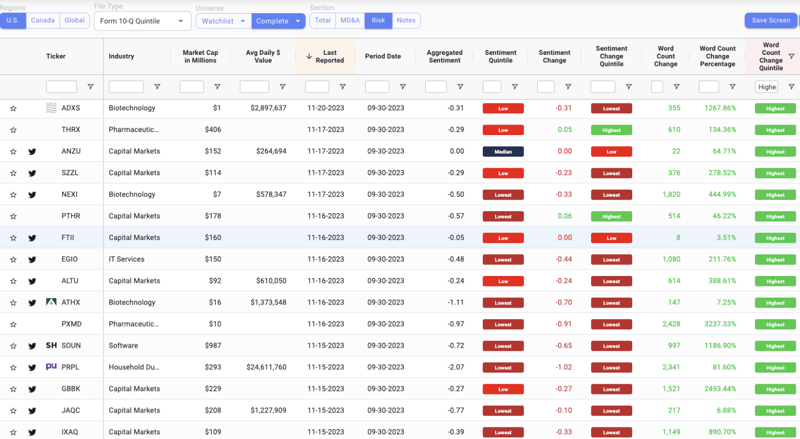
Furthermore, the user has the option to break down sentiment analysis even further by choosing specific sections of the fillings. For instance, users can focus on sentiment changes within the risk section, gaining a more nuanced understanding of how perceived risks have evolved over time. This level of granularity enhances the tool’s utility for investors and analysts seeking to extract actionable insights from regulatory filings.
Comparison Tool
The Comparison Tool within the User Dashboard Tool (UDT) serves as a powerful feature for users aiming to explore and analyze SEC filings in greater detail. When navigating through documents found on the Grid Page, the Comparison Tool allows users to visualize changes from previous filings, providing a nuanced understanding of how companies evolve their disclosures over time. For instance, let's take the example of Ayala Pharmaceuticals, which exhibited a notably high word count percentage change in the risk section.
Using the Comparison Tool, users can delve deeper into this anomaly and uncover the specific modifications made in the company's risk disclosures. Upon closer inspection, it becomes evident that Ayala Pharmaceuticals has added the ongoing situation in Israel as a newly identified risk that they need to monitor in the future.
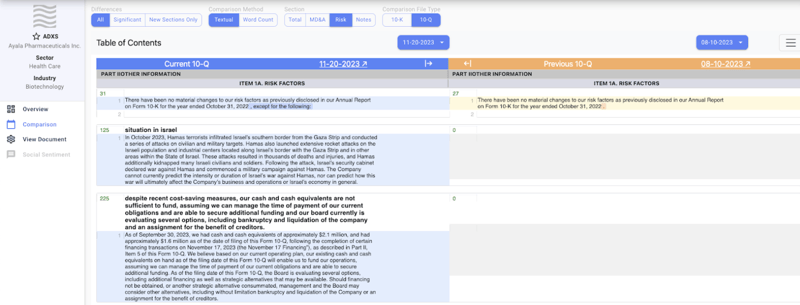
This real-world scenario illustrates the practical application of the UDT in swiftly identifying and comprehending changes in risk factors for companies. By leveraging the Comparison Tool, users can efficiently track modifications in specific sections of filings, enabling them to stay ahead of emerging risks and make informed investment decisions. The UDT not only streamlines the process of identifying alterations in documents but also facilitates a deeper understanding of the evolving dynamics within companies, enhancing the tool's utility for financial analysts and investors alike.
Theme X Tool
The Theme X tool is another valuable tool for users navigating the complex landscape of regulatory filings. Offering users the capability to search for specific phrases and words within a designated time frame, Theme X provides a detailed output that includes the number of companies with this language, the number of filings, and key temporal information such as the first and last mention of the specified phrase. Additionally, the tool breaks down the sector distribution of mentions, providing users with a comprehensive understanding of how the chosen theme is distributed across different industries. Furthermore, Theme X enhances user comprehension by highlighting the searched-for phrase within the original text of the filings.
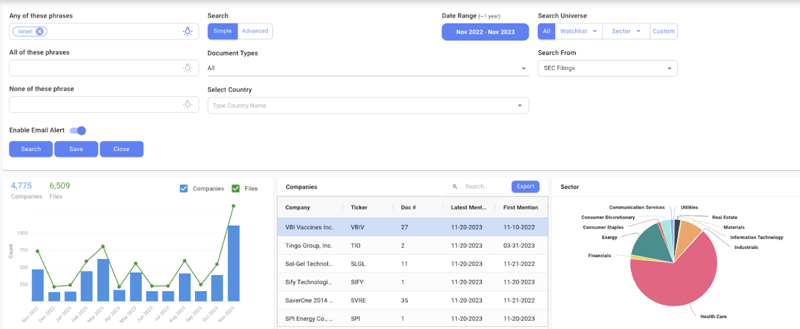
This multifaceted tool proves invaluable for tying current events into regulatory filings, enabling users to gauge which companies are most impacted or concerned about particular topics. For instance, in the context of the recent Israeli conflict, a custom search on Theme X can swiftly identify companies that have addressed the conflict in their filings and assess the level of concern expressed. This functionality positions ThemeX as a dynamic resource for staying ahead of current events, offering users a proactive means of identifying potential market impacts.
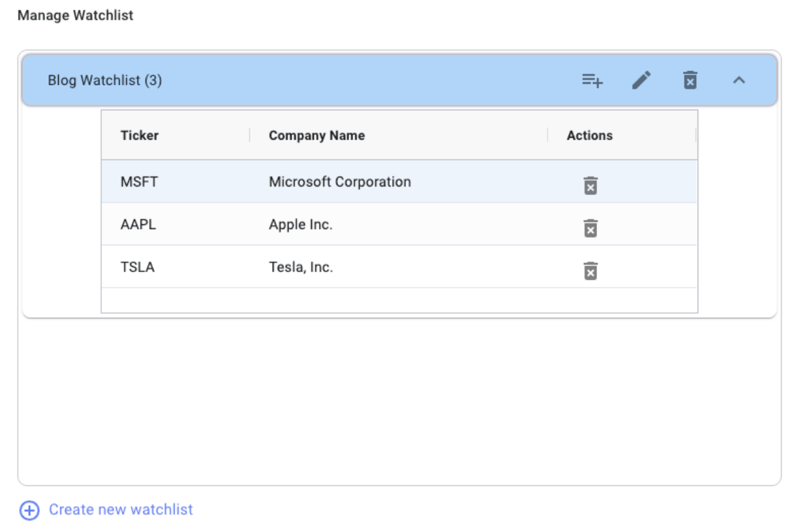
Watchlist and Alerts
UDT also incorporates a robust alert feature, providing users with the ability to create custom alerts and watch lists for companies. On the watchlist page, users can add companies to a larger themed group to monitor. For example, in this blog, we added Microsoft, Apple, and Tesla to a watchlist.
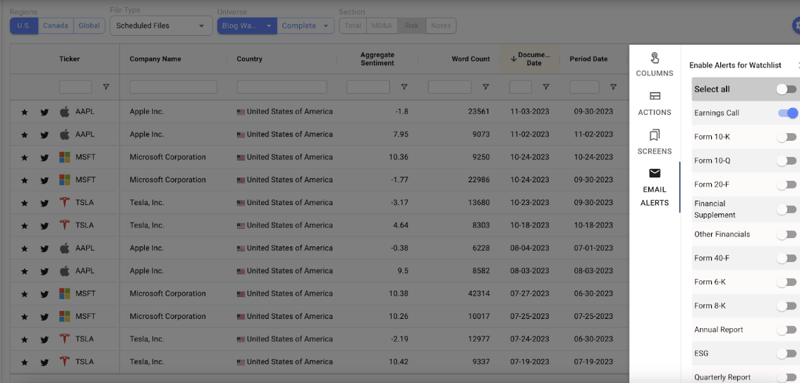
Within the Grid View, users can tailor their experience by setting up email alerts for specific filings related to their watch list. For example, users can receive timely notifications for important events such as earnings calls, ensuring they stay informed about key developments for the companies they are tracking.
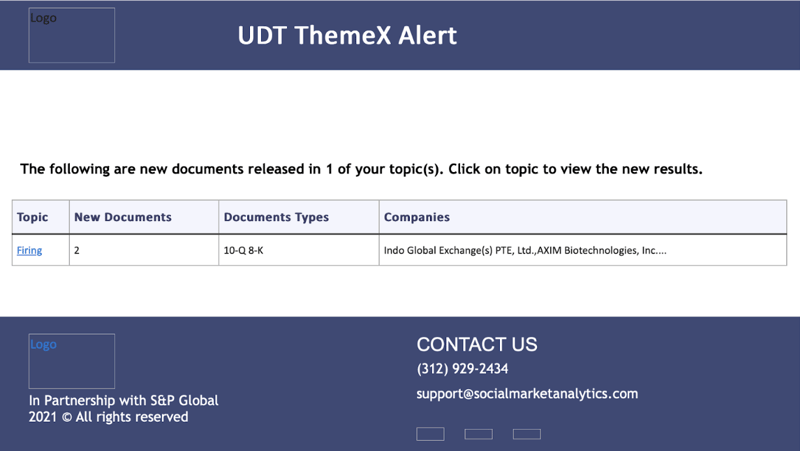
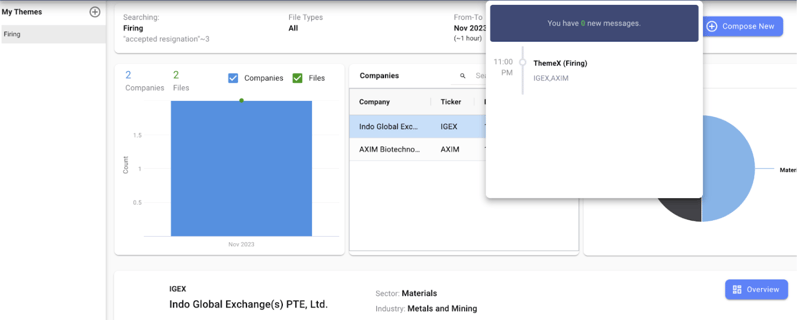
In addition to watch list alerts, the Theme X tool further enhances user engagement by allowing them to save custom searches. Users have the flexibility to save Theme X queries and set up email alerts for filings that contain certain language or phrases of interest. This feature is particularly powerful as it enables users to stay proactive in monitoring specific themes or issues across regulatory filings.
To illustrate, consider a user interested in tracking instances of major personnel changes in companies. They can create a Theme X query, naming it ‘Firing’, and configure the system to email alerts whenever ‘Accepts Resignation’ is said within 3 words of each other in filings. This functionality streamlines the monitoring process, allowing users to receive real-time updates on topics that matter most to them.
Closing
The Unstructured Data Terminal is a comprehensive and sophisticated platform that empowers users to navigate the complex world of financial information and regulatory filings with precision and efficiency. Offering a diverse suite of features, the UDT’s Grid Page serves as a centralized hub for SEC filings, allowing users to customize their view based on region and file type. The Comparison Tool enhances document analysis by visualizing changes from previous filings, enabling users to identify critical shifts in a company’s disclosures. ThemeX facilitates dynamic searches for specific phrases, tying current events into filings and providing users with an understanding of company responses to external factors. Moreover, the UDT’s alert system enables users to stay proactive, receiving timely notifications for watch list filings and ThemeX searches, ensuring they are informed about key developments. The integration of sentiment metrics and trends adds a valuable layer to the tool, offering users both quantitative and qualitative insights into market sentiment. Altogether, the UDT provides a powerful and intuitive toolset for investors, analysts, and decision-makers, enhancing their ability to derive insights from unstructured financial data. For more information on the UDT or information about a trial, visit www.contextanalytics-ai.com or click the button below!
