Context Analytics (CA) is the leader in processing and structuring textual data for sentiment analysis. CA ingests data from a variety of sources including Twitter, StockTwits, Reddit, News, Corporate Filings, and custom inputs. Today, we’ll be focusing on CA’s Twitter S-Factor feed, which grades the sentiment from Twitter messages on a scale of -1.000 to 1.000, aggregates them over a 24-hour period, and compares it to a historical baseline of 20 days to create S-Factors. The S-Factor feed is one of Context Analytics’ longest-running products and includes the S-Score, which is a description of how positive or negative sentiment is by security.
S-Score is calculated by security and gives a cross-sectional view of Social Sentiment without bias towards message volume because the security’s sentiment is being compared to its historical baseline.
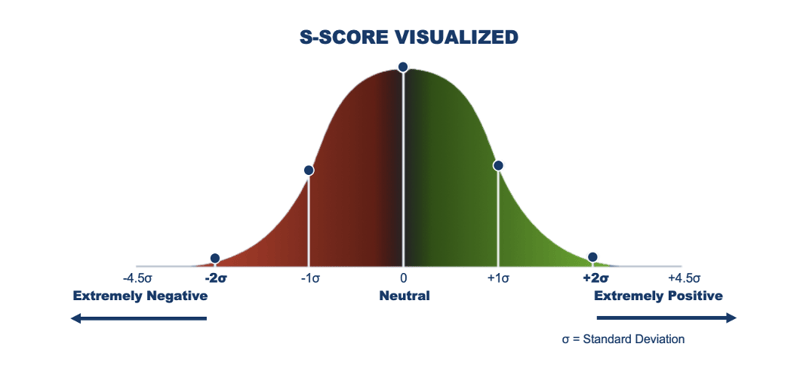
Securities with extremely positive sentiment we expect to outperform the market, while securities with extremely negative sentiment we expect to underperform.
We ran a quintiles test on this data, bucketing securities daily into 5 groups based on their S-Score at 9:10 am ET (20 minutes before market open). Quintile 5 represents the top 20% of S-Scores each day, Quintile 4 the next highest 20%, and so forth until Quintile 1 contains the lowest 20% of S-Scores each day.
We calculated the daily Open-to-Close returns for each security. Securities within each quintile are equally weighted to create daily quintile returns and then cumulated over time. The graph below shows the cumulative return of S-Score quintiles since the beginning of 2022. This universe of securities contains any stock with a CA S-Score and if the close price from the previous day is greater than $5.
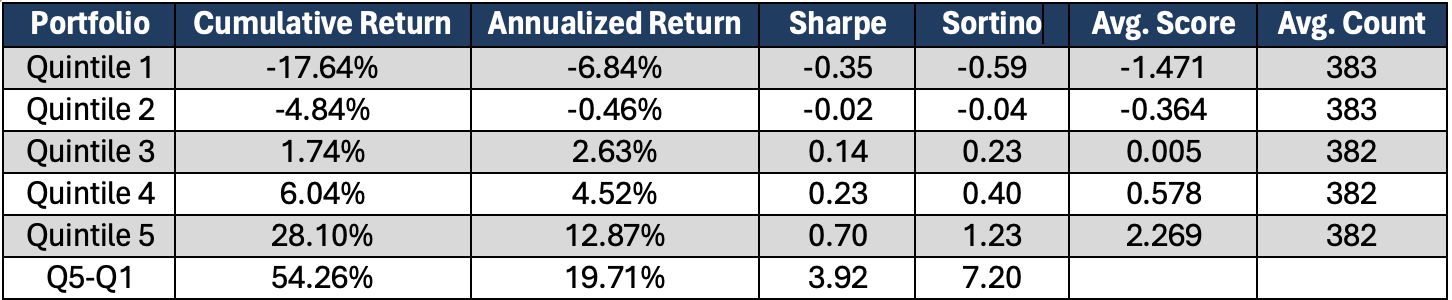
The charts above clearly demonstrate a pattern between the S-Score and the subsequent Open-to-Close return period. When the S-Score is high, meaning sentiment on Twitter is more positive than normal, then the stock outperforms its peers. When the S-Score is low, it underperforms. There is a significant spread between Quintile 5 and Quintile 1 which generates a good Long/Short strategy. Based on the average count of each quintile, these graphs include the returns of ~1910 securities each day.
Context Analytics’ S-Factor feed is the company’s most mature product. Our offering of 10+ years of out-of-sample data and a suite of sentiment factors makes this dataset unique and ideal for backtesting. With this dataset, users can harness the power of social media in financial markets. For more information, click the button below or visit our website www.contextanalytics-ai.com .
