Context Analytics is the leader in processing and structuring textual data for sentiment analysis. One of Context Analytics’ longest-running products is the S-Factor feed. The S-Factor feed is a suite of metrics that describe Social Sentiment from messages on a social media platform separated by source.
One source used for the S-Factor feed is StockTwits, which is a social media platform for investors and traders to share ideas about the market or specific securities. Context Analytics reads all messages that contain terms from a security’s topic model, which is a collection of rules such as ticker, company name, and other company identifiers. Sentiment from messages is graded on a scale of -1.000 to 1.000. Message sentiment and count are aggregated over a 24-hour period and compared to a historical baseline of 20-days to create S-Factors. These factors are updated every single minute.
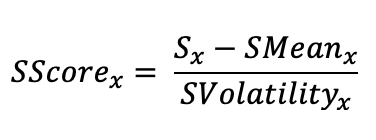
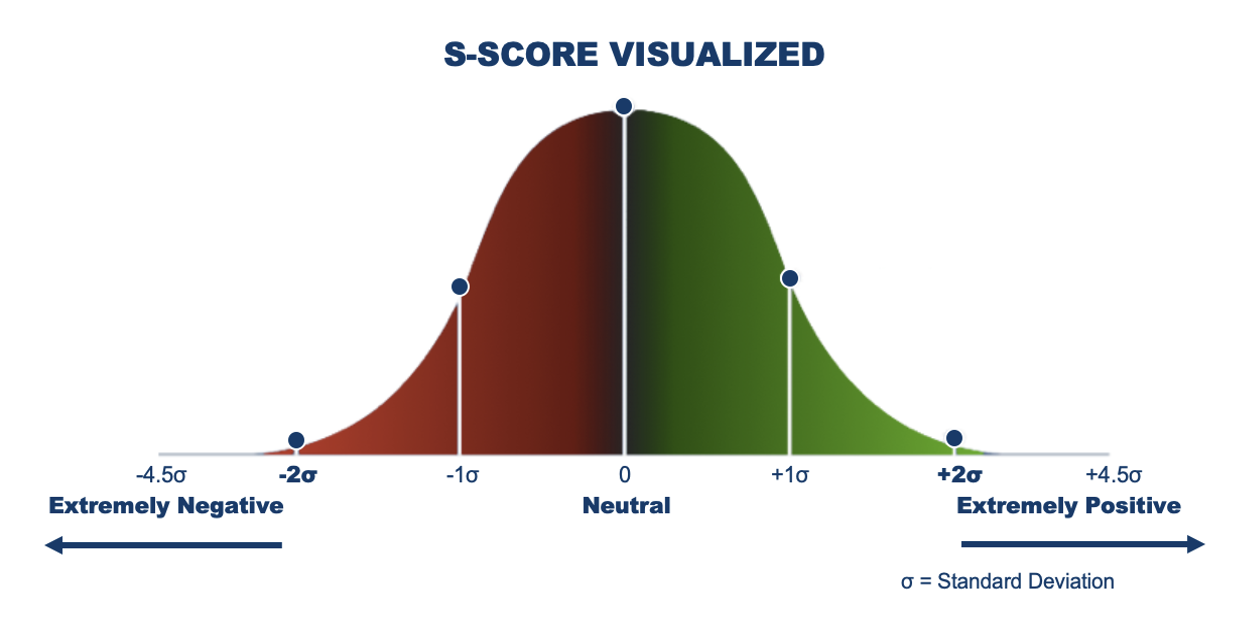
The S-Score is an exponentially weighted summation of sentiment from messages on a security in the past 24-hours (`S`) compared to the mean (`SMean`) and standard deviation (`SVolatility`) from the previous 20 days. Sentiment is exponentially summed so messages from a few minutes ago hold more weight than messages from 23 hours ago. This gives a cross-sectional view of Social Sentiment without bias towards message volume because the security’s sentiment is being compared to its historical baseline. Below is a formula for calculating S-Score, where x represents the timestamp taken. For Open-to-Close predictions, we take 9:10am ET sentiment data and for Close-to-Close prediction, we take 3:40pm ET data.
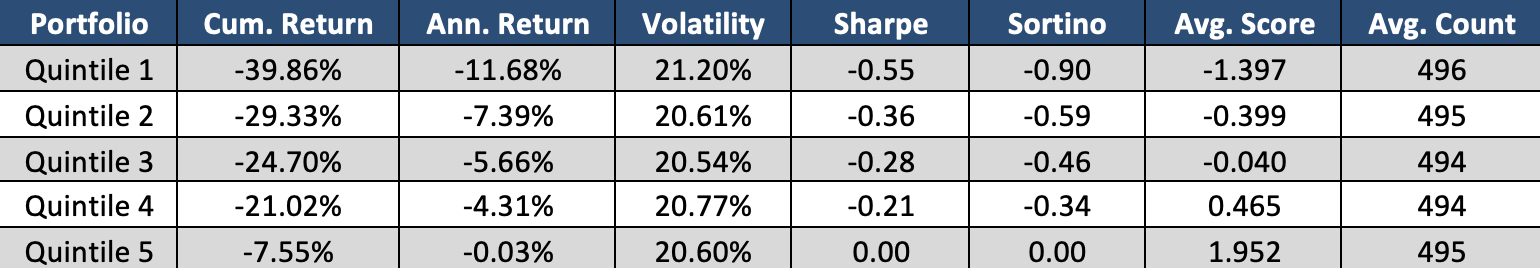
To run a quintiles test on this data, we bucket securities daily into 5 groups based on their S-Score. Quintile 5 represents the top 20% of S-Scores, Quintile 4 the next highest 20%, and so forth until Quintile 1 contains the lowest 20% of S-Scores each day.
We calculated the daily Open-to-Close returns for each security. Securities within each quintile are equally weighted to create daily quintile returns and then cumulated over time. The graph below shows the cumulative return of S-Score quintiles since the beginning of 2020.
We then did the same practice with Close-to-Close returns. The portfolios are constructed the same as above, the only difference is using sentiment data from pre-market close and the different return periods.
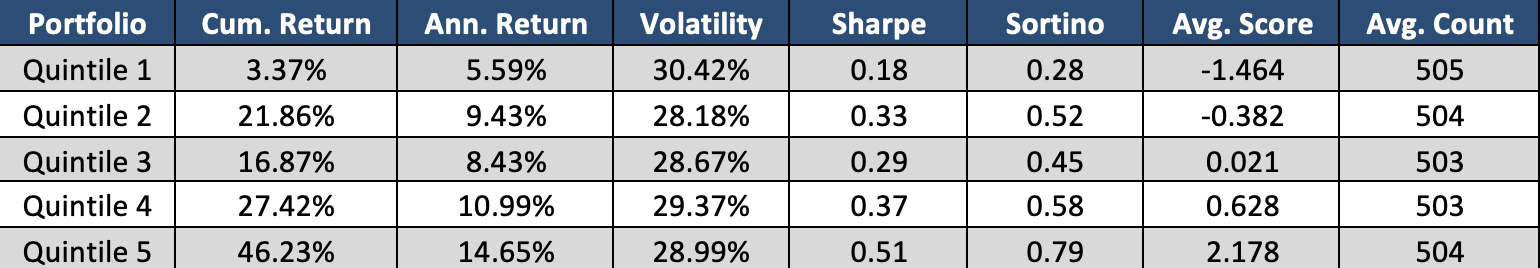
The charts above clearly demonstrate a pattern between the S-Score and the subsequent return period. When the S-Score is high, meaning sentiment on StockTwits is more positive than normal, then the stock outperforms its peers. When the S-Score is low, it underperforms. There is a significant spread between Quintile 5 and Quintile 1 which generates a good Long/Short strategy. Based on the average count of each quintile, these graphs include the returns of ~2500 securities each day.
Context Analytics’ S-Factor feed is the company’s most mature product. Our offering of 10+ years of sample data and 15 different sentiment factors makes this dataset unique and ideal for back testing. With this dataset, users can harness the power of social media in financial markets. For more information, click the button below or email us at ContactUs@ContextAnalytics-AI.com
