Context Analytics is the leader in processing and structuring textual data for sentiment analysis. One of Context Analytics’ most mature products is the S-Factor feed. The S-Factor feed is a suite of metrics that describe sentiment from messages on social media. In many of our previous blogs, we demonstrate the predictive power of S-Score, a sentiment metric that tells a user the current sentiment on a security over the past 24 hours compared to a baseline of 20 days. S-Score could be paired with a variety of other S-Factors (s-volume, sv-score, s-dispersion, s-buzz, etc.) to create a complete view of a security’s social media activity. One source used for the S-Factor feed is StockTwits, which is a social media platform for investors and traders to share ideas about the market or specific securities.
The S-Score gives a cross-sectional view of Social Sentiment without bias toward message volume because the security’s sentiment is being compared to its historical baseline. The S-Score is multiplied by S-Buzz, which is a measurement of the stock’s Twitter volume compared to the entire US Equity universe. The minimum value of S-Buzz is 0 while its average value is 1. This means any security that has above average conversation level (S-Buzz > 1) will have a larger magnitude on the change in Sentiment Score, while securities with less than average Twitter conversation (S-Buzz < 1) will have a reduced value on the change in Sentiment Score. Here is the formula for the factor, where x is today’s date:
To run a quintiles test on this data, we bucket securities daily into 5 groups based on the value of the Combo Factor. Quintile 5 represents the top 20% of values, Quintile 4 is the next highest 20%, and so forth until Quintile 1 contains the lowest 20% of values each day.
We calculated the daily Close-to-Close returns for each security. Securities within each quintile are equally weighted to create daily quintile returns and then cumulated over time. The graph below shows the cumulative return of quintiles since the beginning of 2014, nearly 10 years.
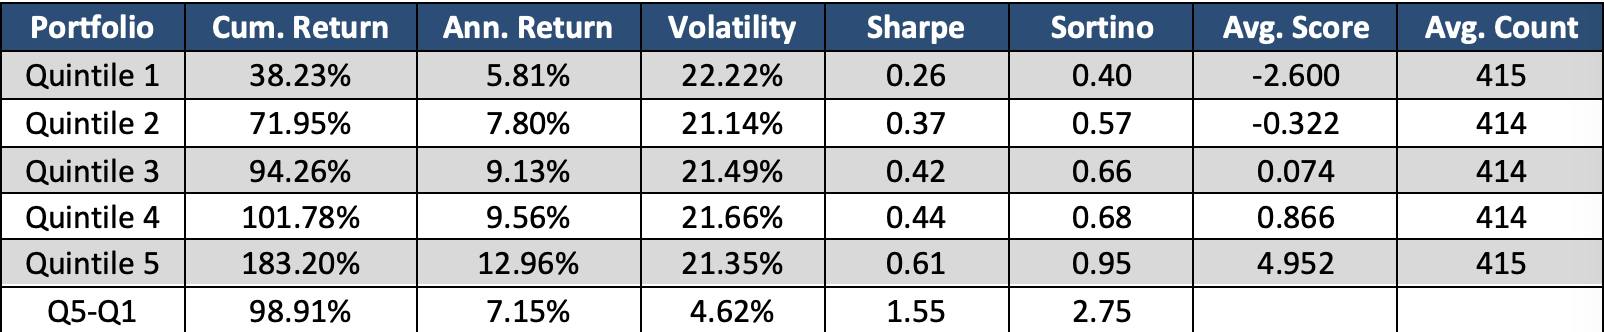
The chart above demonstrates a pattern between the Combo Factor and the subsequent daily close-to-close returns. When there is a combination of high message volume and positive sentiment, those securities tend to overperform the market. On the opposite end, securities with negative sentiment with buzz, end up underperforming. This sample has on average 2000+ securities each day with sentiment signals. Additionally, the spread between Quintile 5 and Quintile 1 registers a Sharpe ratio of 1.55. This is much less risky than the market or any of the individual quintiles. The reduction in volatility contributes to the high Sharpe and Sortino ratios.
Context Analytics’ S-Factor feed is the company’s most mature product. Our offering of 10+ years of sample data and 15 different sentiment factors makes this dataset unique and ideal for back testing. With this dataset, users can harness the power of social media in financial markets. For more information, click the button below or email us at ContactUs@ContextAnalytics-AI.com
