Context Analytics is the leader in processing and structuring textual data for sentiment analysis. One of the longest-running products is the Context Analytics S-Factor feed. The S-Factor feed is a suite of metrics that describe Social Sentiment from Twitter and StockTwits messages separated by source.
On Twitter, Context Analytics has its proprietary account rating algorithm that grades accounts based on a variety of factors relating to financial Tweets. If an account passes the algorithm, then its Tweets are included in the S-Factor metrics moving forward. On StockTwits, all accounts are included in the metrics because people who are active on the platform only discuss financial topics.
Context Analytics has topic models for each individual security, which is a collection of rules that are company identifiers. This allows us to know which messages reference which companies. Messages that match any topic model rule is ingested and graded on sentiment from a scale of -1.000 to 1.000. Message sentiment and count are aggregated over a 24-hour period and compared to a historical baseline of 20 days to create S-Factors. These factors are updated every single minute.
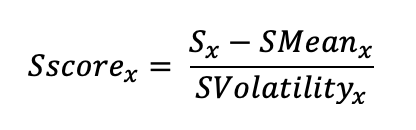
The S-Score, one of many S-Factors, is an exponentially weighted summation of sentiment from messages on a security in the past 24-hours (`S`) compared to the mean (`SMean`) and standard deviation (`SVolatility`) from the previous 20 days. Sentiment is exponentially summed so messages from a few minutes ago hold more weight than messages from 23 hours ago. This gives a cross-sectional view of Social Sentiment without bias towards message volume because the security’s sentiment is being compared to its historical baseline. Below is a formula for calculating S-Score, where x represents the timestamp taken. For Open to Close we take 9:10am and for Close to Close we take 3:40pm.
For this research, we investigated blending the Twitter and StockTwits S-Score into one metric for trading. So, for each security we took the average of the Twitter and Stocktwits S-Score at the respective timestamp. Therefore, we only kept securities that had sentiment on both platforms. If a security had no message volume on either platform, it was disregarded. We then bucketed the securities into quintiles daily based on the average S-Score. The securities must also have a share price greater than $5. Quintile 5 represents the top 20% of scores, Quintile 4 the next highest 20%, and so forth.
We calculated the daily Open-to-Close returns separated by quintile and cumulated returns over time. The graph below shows the quintile's cumulative return since the beginning of 2022.
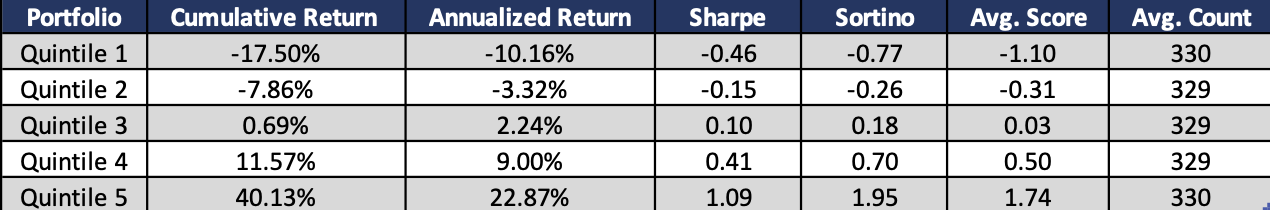
This demonstrates the relationship between the Average S-Score and subsequent Open-to-Close returns. As the average S-Score increases, the annualized returns increase as well. At the same time, the lower S-Scores underperform.
We then investigated Close-to-Close returns to test if the relationship continues outside of market hours. The portfolios are constructed the same as above, only using sentiment data from pre-market close.
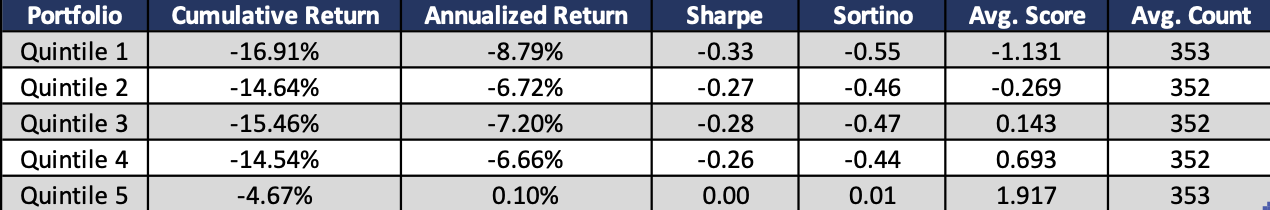
The higher quintiles still outperform the lower quintiles. For context, SPY was down 5% over this time and top quintile yields a positive return annually. The Average S-Score continues to be predictive of market returns even with overnight risk.
Context Analytics’ S-Factor feed is the company’s most mature product. Our offering of 10+ years of sample data and 15 different sentiment factors makes this dataset unique and ideal for backtesting. With this dataset, users can harness the power of social media in financial markets. For more information, click the button below or email us at ContactUs@ContextAnalytics-AI.com
