Context Analytics is an official partner of Twitter and the exclusive distributor of StockTwits data. We calculate sentiment based on messages from these two separate sources in individual data feeds. In this blog, we explore how our S-Score metric compares across Twitter and StockTwits, and ways users can use factors from both datasets to create a predictive trading strategy. Context Analytics’ S-Factors are calculated the same exact way across Twitter and StockTwits. The only difference between the two data feeds is the raw textual data from the messages posted on the two platforms.
In a previous blog we discuss the predictive nature of Context Analytics’ S-Score from both Twitter and StockTwits and compare a daily strategy from each source. Here, we will merge the two datasets to create a unique factor.
This custom factor takes the average S-Score from the Twitter and StockTwits feeds. The rationale is if there’s no S-Score or a large difference in S-Scores between the two sources, then the information contributing to the score is not impactful. If both sources have a similar S-Score, then the sentiment associated with the Twitter and StockTwits message volume is actionable.
In this daily strategy we use a universe of securities with Price > $5 to exclude penny stocks and other securities with liquidity concerns. The mean S-Score must be > 2 to be included in the Longs bucket and < -2 to be in the Shorts bucket. We take the S-Score 20 minutes prior to Market Open (9:10 am ET). Below is a graph of an Open-to-Close daily rebalanced strategy using the mean S-Score.
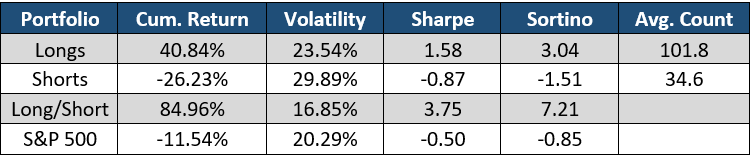
In 2022, using the average S-Score between Twitter and StockTwits was great for Open-to-Close trading. On average, each morning there were over 100 securities with an average S-Score > 2 and ~35 securities with an average S-Score < -2. Trading these securities based on sentiment and creating an equally weighted Long/Short yielded a return of over 80% in 2022.
Another way to combine the Twitter and StockTwits dataset is by confirming one signal with the other. Instead of taking the average between the two S-Scores and filtering on the new factor, a user can see if a security has an S-Score > 2 or < -2 in both data sets. Each day there would be fewer securities in the Long and Short buckets compared to the strategy above.
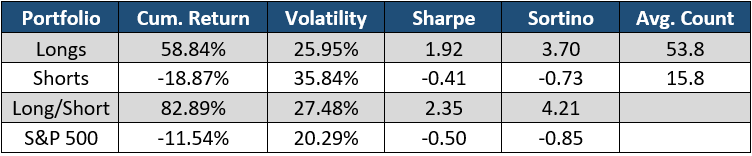
This graph behaves similarly to the portfolio above. The number of securities traded is roughly half of the portfolio above, but the returns are similar. Because there are fewer securities traded each day, the volatility of daily returns is higher on the Long/Short portfolio driving its Sharpe ratio down.
This same strategy using only Twitter data yields a Long/Short cumulative return of 62% in 2022. Using multiple Social Media sources to confirm a Social Sentiment signal enhances the Long/Short return of the portfolio by over 20% this past year.