Twitter can be leveraged to enhance stock selection and identify intraday price movements. A more extreme S-Score threshold can improve portfolio returns too.
One of Context Analytics' (CA) most popular metrics is the S-Score. The S-Score describes the sentiment on the current Twitter conversation relative to the stock’s historical baseline. Sentiment is scored using CA’s proprietary Natural Language Processing and messages are aggregated over certain periods with historical means and standard deviations also calculated. The S-Score is a z-score using these Sentiment values.
When the S-Score is higher, that means the exponentially weighted sentiment from the previous day is higher than the previous 20-days. A high S-Score is described as a positive sentiment, and we expect the security to outperform the general market. The same goes for when S-Score is low. That means sentiment on Twitter is lower than typical and we’d expect the security to underperform the market.
To see how thresholds compare to each other, we have created a portfolio for each of the following 6 S-Score thresholds: > 3, > 2, > 1 and < -1, < -2, < -3. The data is taken before the market open and is rebalanced daily. The portfolios look at Open-to-Close returns for stocks that reach the respective thresholds of each portfolio. Securities within each portfolio are equally weighted.
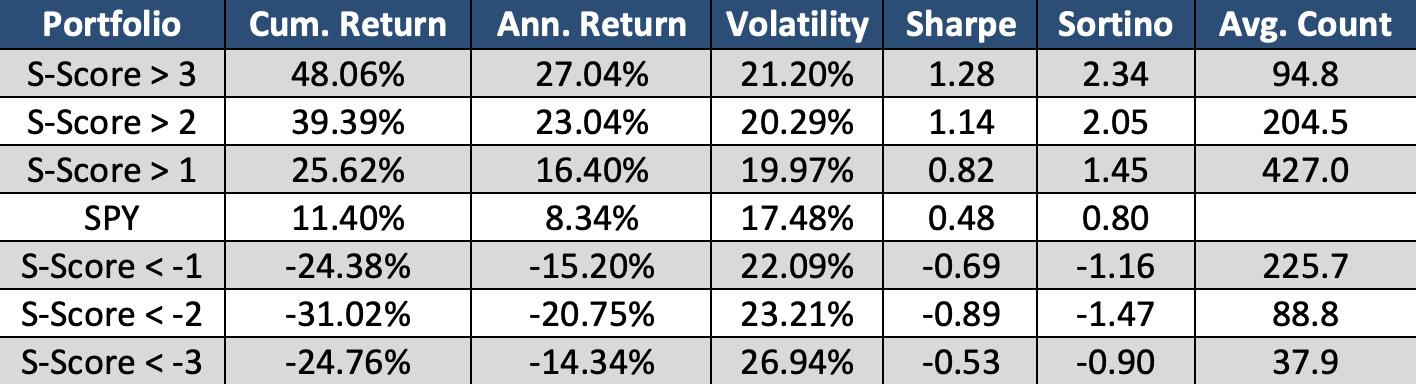
On the Long side, the highest S-Score threshold outperformed the rest and had the highest Sharpe Ratio. There were on average 94.8 securities with a S-Score > 3 each day. Those stocks equally weighted each day taking returns from market open to market close, accounts for a cumulative return of 48.06% since the beginning of 2022. An S-Score > 1 includes 427 securities each day which is over quadruple the S-Score > 3 bucket. The return of the S-Score > 1 bucket is still significantly above SPY and has reduced volatility compared to all other buckets.
Interestingly, on the Short side, the S-Score < -2 bucket had the lowest return. It isn’t nearly as volatile as the S-Score < -3 bucket because there are on average 88.8 securities compared to 37.9. The more securities in the bucket, the less volatile the portfolio’s return.
These portfolios demonstrate using social sentiment, or more specifically S-Score, for stock selection will enhance portfolio returns and risk. On the Long side, more extreme sentiment values lead to higher returns, while also reducing the number of securities in the portfolio. The short side shows that the most extreme values don’t produce the best return, however, it still is a good gauge for securities underperforming the market. For more information on Context Analytics, please click the button below or email us at contactus@contextanalytics-ai.com.
