Context Analytics is the leader in processing and structuring textual data for sentiment analysis. We ingest data from a variety of sources including Twitter, StockTwits, Reddit, News, Corporate Filings, and custom inputs. Today, we’ll be focusing on Context Analytics’ Twitter S-Factor feed, which grades the sentiment from Twitter messages on a scale of -1.000 to 1.000, aggregates them over a 24-hour period, and compares it to a historical baseline of 20 days to create S-Factors. The S-Factor feed is one of our longest-running products and includes the S-Score, which is a description of how positive or negative sentiment is by security.
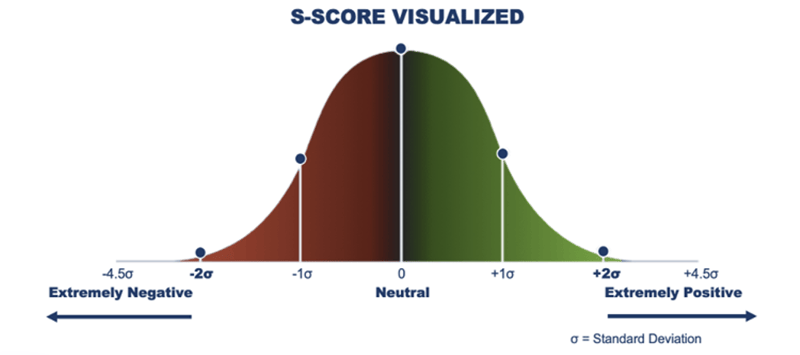
S-Score is calculated by security and gives a cross-sectional view of Social Sentiment without bias towards message volume because the security’s sentiment is being compared to its historical baseline.
In this blog, we'll explore the application of the Twitter S-Score in monitoring pre-Earnings Call discussions about companies. To conduct our analysis, we examined earnings call dates for companies dating back to 2011. We gauge sentiment by security each day utilizing the premarket close S-Score. We then see how the sentiment relates to the stock’s performance following earnings calls. For each security, we computed two return windows: the subsequent Close-to-Open return and the subsequent Close-to-Close return. These returns were adjusted against the performance of the SPY index to facilitate comparison across different time periods.
categorized securities into buckets: S-Score greater than 2 serves as our conventional long signal, denoting extreme positive sentiment, while S-Score less than -2 signifies our traditional short signal, indicating extreme negative sentiment. The neutral category encompasses the remaining securities.
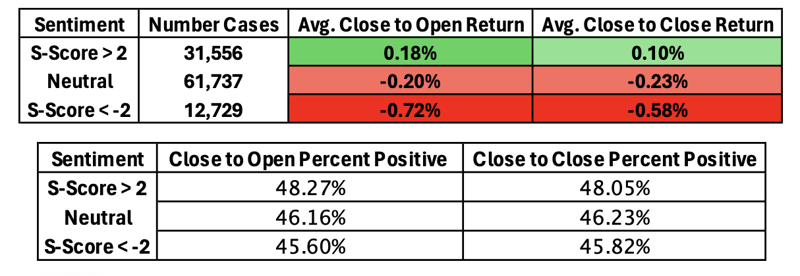
Our analysis showed that securities with S-Scores above 2 had returns that outperformed the SPY index and others. This suggests that positive sentiment on Twitter may precede favorable earnings calls. Moreover, the percentage of positive returns increased by over 2% when S-Score was above 2 compared to the neutral category. Conversely, securities with S-Scores below -2 experienced negative returns, suggesting that negative sentiment on Twitter may anticipate disappointing earnings calls. The percentage of positive returns also dropped when compared to the neutral category.
These findings have implications for risk analysis and trading strategies. By considering Twitter sentiment from Context Analytics, investors may identify companies likely to have positive or negative earnings surprises. This insight can inform decisions and help manage risk exposure. For more information on the S-Factor feed email us at ContactUs@ContextAnalytics-ai.com or click the button below!
