S-Factors enables users to dissect single stock sentiment as expressed on social media. By tracking which securities have increasing or decreasing sentiment, users can create a strategy that yields over 30% annually over the past 5 years.
A large portion of stock market return over the past 5 years has come from overnight price movement. After-hours trading has increased volatility, which in turn breeds opportunity for investors. This blog explores a daily trading strategy using only overnight trading (Market Close to next day Market Open) with change in Sentiment and Twitter Volume factors.
The rationale is securities with above average Tweet Volume and increasing sentiment throughout the trading day, would go on to outperform during after-hours trading. While securities with low Tweet Volume and a decrease in sentiment would underperform. Context Analytics’ S-Factors allow users to isolate these social sentiment factors and make intuitive decisions.
To calculate change in sentiment throughout the trading day, we take the difference in Context Analytics S-Score from 9:10am to 3:40pm ET. Any change in S-Score > 1 or <-1 can be considered a significant enough change.
Context Analytics’ SV-Score standardizes Twitter Volume by security. An SV-Score > 1 is considered above average volume and a SV-Score < 0 below the security’s mean Tweet Volume.
Using these two metrics we create rules for grouping securities daily:
Longs: SV-Score > 1 &. S-Score Change > 1
Shorts: SV-Score < 0 &. S-Score Change < -1
Each portfolio is equally weighted by the number of constituents passing the thresholds daily. An equally weighted theoretical Long/Short is shown below.
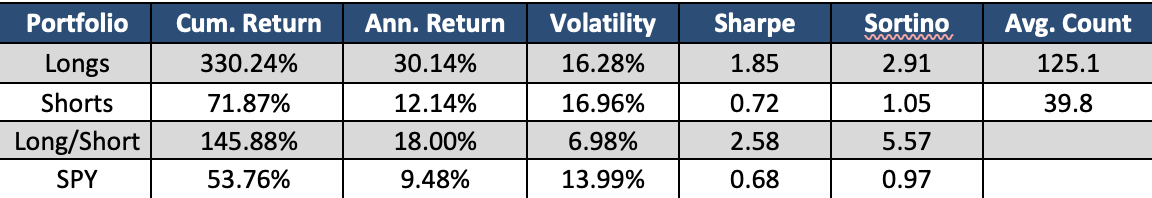
The strategy above looks great as a Long Only portfolio over the last 5 years. However, in a bear market like what the market experienced in 2022, the Long/Short portfolio shows its true value. With much lower volatility compared to the other portfolios, the Sharpe ratio demonstrates the risk adverse nature of the strategy while also outperforming SPY. The Long portfolio typically contains ~125 securities while ~40 securities are in the Short portfolio daily.
There are thousands of derivative factors, like the S-Score change above, which can be created from Context Analytics’ S-Factor feed. Context Analytics is theleader in unstructured data. To learn more about our products or to trial S-Score, click the button below OR email us at ContactUS@ContextAnalytics-AI.com.
