Context Analytics is thrilled to announce the official launch of our Quantitative News Feed. In this blog post, we delve into new research on sentiment analysis derived from news articles. Context Analytics employs proprietary natural language processing techniques, which have proven to generate alpha in financial markets for over a decade.
Expanding on initial news research, we explore a longer-term application of our Quantitative News Feed. Our methodology involves applying a weight to all S&P 500 constituents and comparing that portfolio to that of the SPY index.
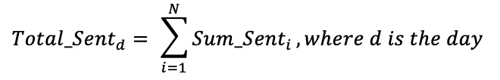
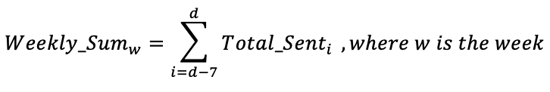
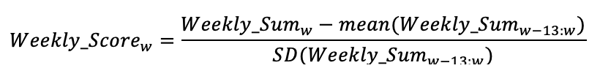
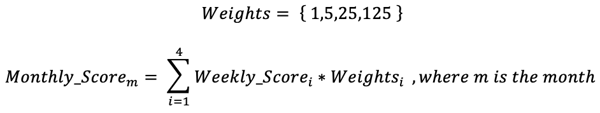
Our objective was to devise a monthly sentiment score with weighted adjustments, placing greater emphasis on recent news updates. At the core is Sum of Sentiment, which aggregates sentiment scores from each article based on our scoring system. We extend this by conducting a comprehensive summation for each company over the preceding 24 hours, followed by a rolling weekly aggregation. Subsequently, we standardized this weekly aggregate over the previous quarter (13 weeks). Utilizing this data, we then assign weights to the weekly standardized scores of the past four weeks (equivalent to one month) to generate our exponentially weighted monthly score. This approach prioritizes recent sentiment trends. Mathematically, this process is expressed as follows:
- Total Sentiment per day:
- Rolling Week Summation:
- Rolling Weekly Score Standardized over the previous Quarter (weekday adjusted)
- Weighted Monthly Summation (5x exponentially weighted to recent news)
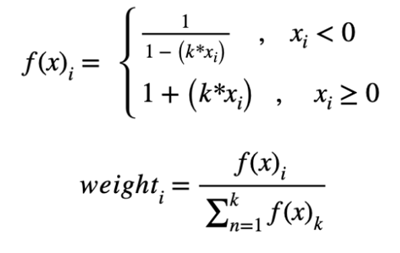
Constituents of the S&P 500 are subsequently weighted according to the Monthly Score. Companies with higher Monthly Scores, signifying a more positive sentiment over the preceding month, are assigned greater weights. The weighting of constituents is determined by the formula provided below, where x represents the Monthly Sentiment Score, i denotes the stock, and k stands for the total number of constituents (500).
Each month, we recalibrate the weights of the S&P 500 constituents using this formula and subsequently maintain our position for the duration of the month. Monthly returns are computed for comparison with those of the S&P 500 ETF Trust (SPY). Our backtesting encompasses our entire two-year historical data.
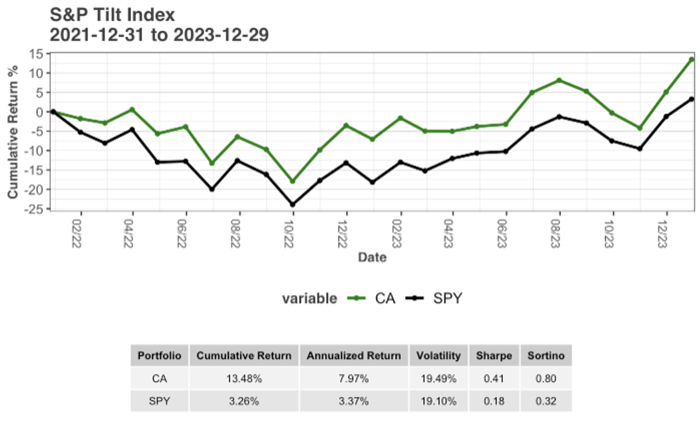
We find that our Context Analytics weighted S&P 500 outperforms the SPY significantly during this period. Specifically, it improves over 10% cumulatively and 4.5% annually while also enhancing Sharpe and Sortino ratios.
This case study demonstrates a unique use case of not only selecting securities but also weighing them based on news sentiment. By aggregating news metrics and leveraging extended positive sentiment, we observe predictive power for longer-term excess returns.
For inquiries regarding a possible trial with our Quantitative News Feed, other Sentiment Data, or Context Analytics in general, please visit our website at www.contextanalytics-ai.com or click the button below!
