Context Analytics (CA) is the leader in processing and structuring textual data for sentiment analysis. CA ingests data from a variety of sources including X, formerly Twitter. CA grades the sentiment from posts on a scale of -1.000 to 1.000, aggregates them over a 24-hour period and compares it to a historical baseline of 20 days to create S-Factors. The S-Factor feed is a suite of metrics that describe sentiment a post volume by company. It is one of Context Analytics’ longest-running products and includes the S-Score, which is a description of how positive or negative sentiment is by security. Many other blogs have demonstrated the predictive power of S-Score, but here we look at a derivative combination factors that can be used for daily trading. We examined the daily change (delta) in S-Score and SV-Score and combined those to create a derivative factor. Below are the formulas used to calculate these factors, where x is the date: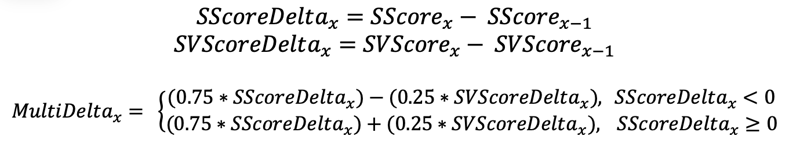
Securities with high SScoreDelta indicate sentiment has risen over the previous 24 hours, which is a positive signal. A positive SVScoreDelta means post volume has risen over the past 24 hours which enhances the signal regardless of sentiment direction. The securities with higher MultiDelta are expected to outperform the rest of the universe while securities with a low score are expected to underperform.
We ran a quintiles test on this data, bucketing securities daily into 5 groups based on their MultiDelta at 3:40 pm ET (20 minutes before market close). Quintile 5 represents the top 20% of MultiDelta scores each day, Quintile 4 the next highest 20%, and so forth until Quintile 1 contains the lowest 20% of MultiDelta scores each day.
We calculated the daily Close-to-Close returns for each security. Securities within each quintile are equally weighted to create daily quintile returns and then cumulated over time. The graphs below show the cumulative return of the MultiDelta quintiles since the beginning of the dataset and since 2020.
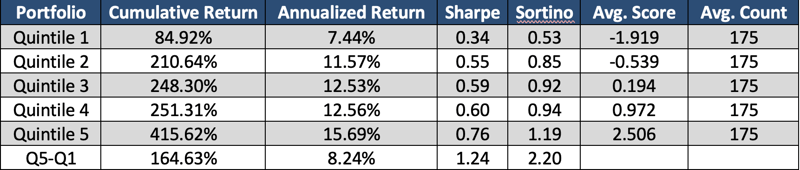
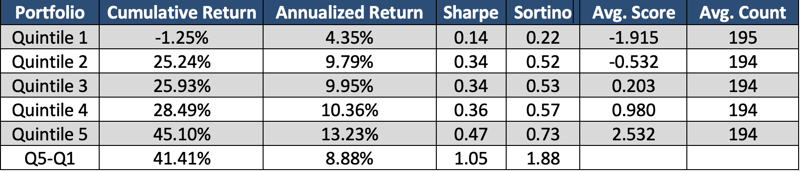
The charts above demonstrate a clear monotonic pattern between the MultiDelta and the subsequent close-to-close return period. This indicates that securities experiencing more positive sentiment and increased discussion on Twitter tend to result in higher subsequent returns, as reflected in Quintile 5. Also, when sentiment diminishes and post volume increases, as seen in Quintile 1, lower subsequent returns are observed. There is a large spread between these two quintiles which yields a nice Long/Short opportunity. This pattern exemplifies another instance of the many ways that metrics from Context Analytics can be manipulated to gain excess returns in the stock market.
Context Analytics’ S-Factor feed is the company’s most mature product. Our offering of 10+ years of out-of-sample data and a suite of sentiment factors makes this dataset unique and ideal for backtesting. With this dataset, users can harness the power of social media in financial markets. For more information, click the button below or email us at ContactUs@ContextAnalytics-AI.com