Context Analytics (CA) works with brokerage firms to bring the uncorrelated and predictive power of social media to their customers. For this blog, we will explore the CA widget implementation for Lightspeed Trader.
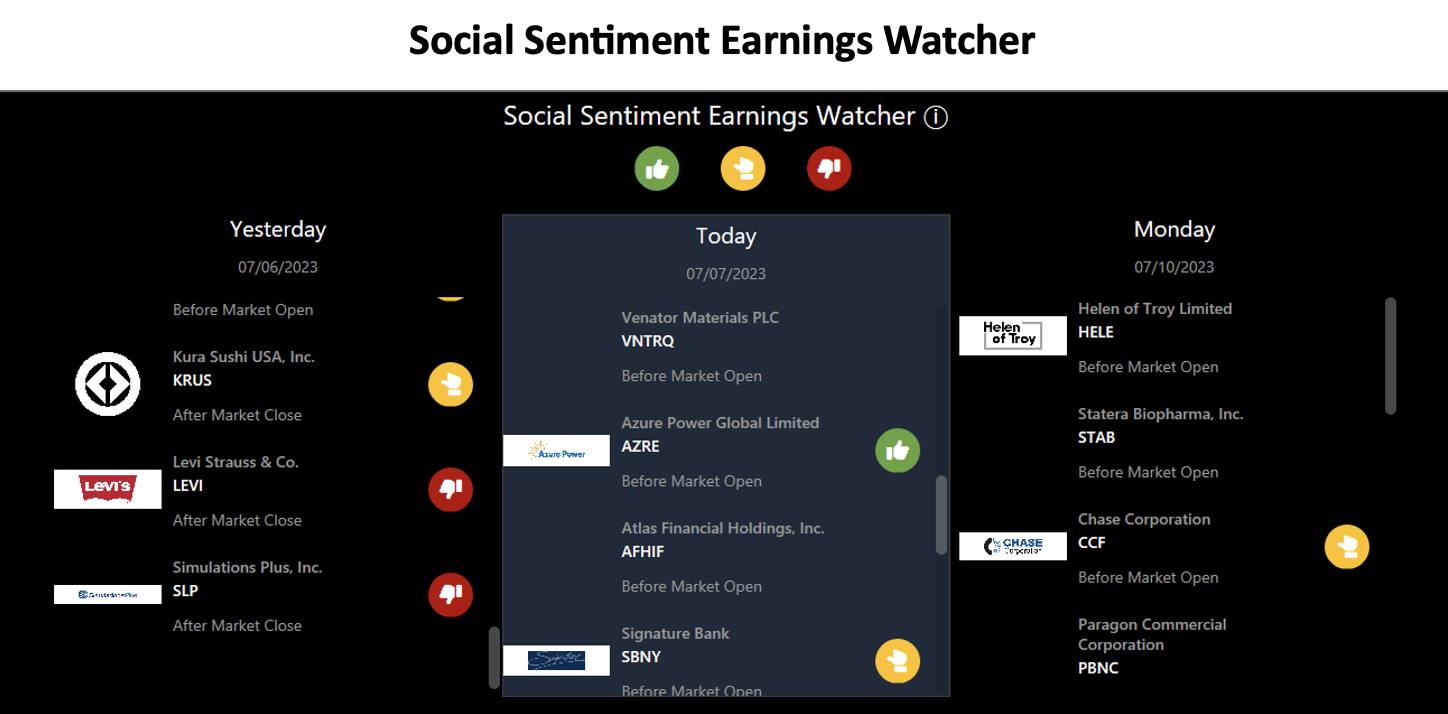
CA’s Social Sentiment Earnings Watcher provides investors with recent earnings events from the previous day, the current day, and the following day, along with the securities’ real-time social sentiment. The green “thumbs up” symbol indicates companies with positive social sentiment (S-Score > 1). The yellow “sideway thumb” indicates a company with neutral social sentiment (S-Score between -1 and 1). The red “thumbs down” indicates a company with negative social sentiment (S-Score < -1). All sentiment score values are updated with real-time Twitter conversations.

The Sentiment Odometer gives an easy-to-read visual of an individual security’s social sentiment for both Twitter and StockTwits, updating every minute. S-Score is a normalized representation of social sentiment of a security in the past 24 hours compared to its own 20-day baseline. The top topics on the top right provide context around the trending topics being discussed on the security in real-time on Twitter and StockTwits, which contributed to the sentiment S-Scores.
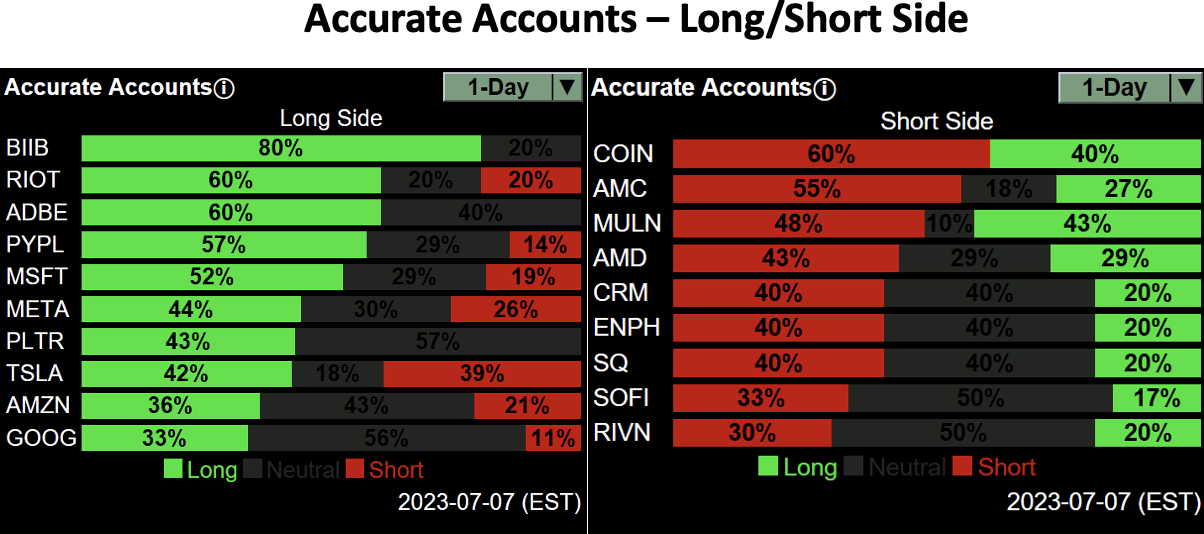
The Accurate Account widgets offer a unique viewpoint by aggregating expectations from Twitter users who are historically proven accurate, both on the long and short side over specific time horizons. Each ticker has a corresponding percentage based on conversations from these accurate accounts mentioning either Long positions (green), Short positions (red), and Neutral positions (dark grey). Different outlook horizons can be selected at 1-Day, 2-Day, 1-Week, 1-Month.
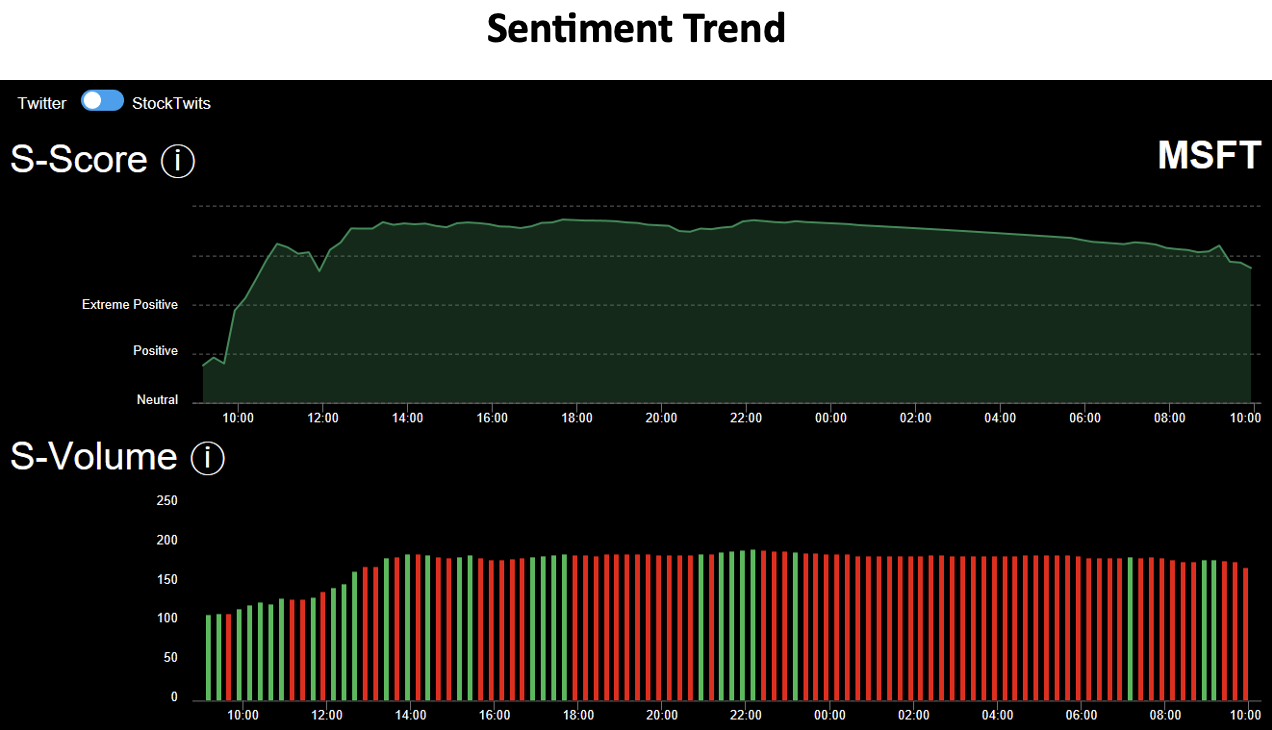
The CA Sentiment Trend widget provides a 24-hour snapshot of a given security’s S-Score and S-Volume. The Y-axis for S-Score ranges from ‘Extreme Negative’ (S-Score < -2) to ‘Extreme Positive’ (S-Score > 2). S-Volume is the indicative tweet volume used to compute the sentiment estimate. This is the number of unique Tweets arriving in a 24-hour interval from certified CA accounts. Both graphs are interactive, giving investors the ability to hover over a specific data point within the 24-hour window.
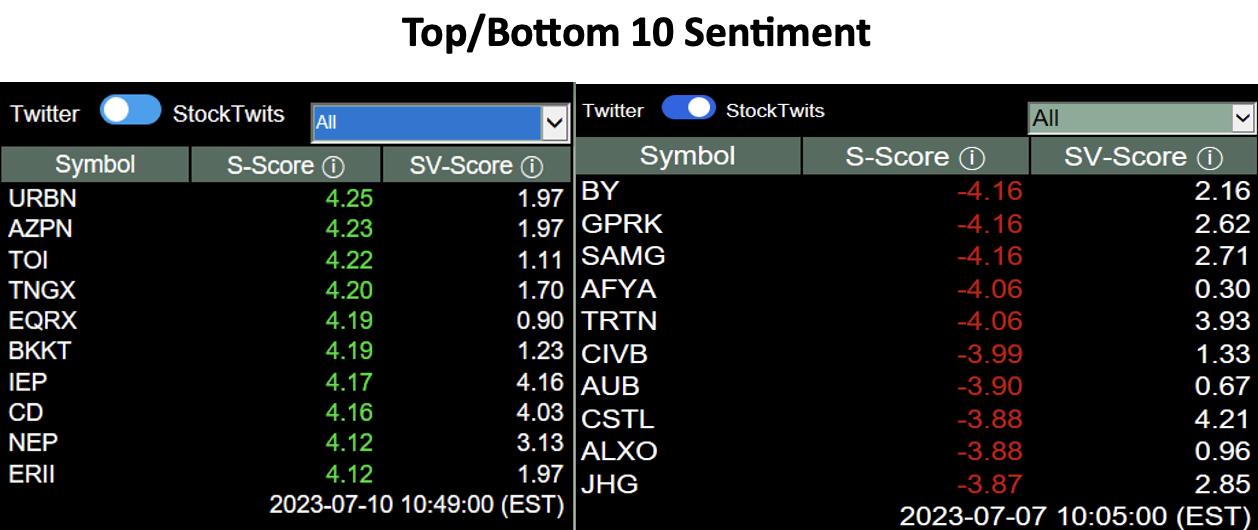
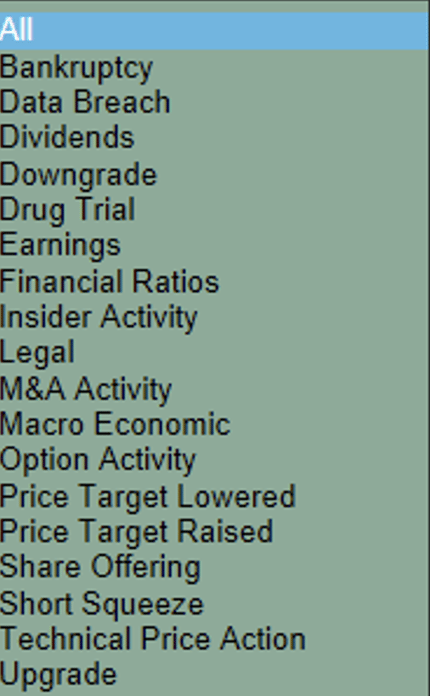
The Top and Bottom 10 Sentiment widgets provide a preview of the Top 10 tickers with the highest/lowest S-Score every minute for both Twitter and StockTwits. SV-Score is the normalized value of S-Volume (Z-score of S-Volume). This value is computed like S-Score. There is also a dropdown menu on the top right to select a specific conversation to see the most positive/negative securities being mentioned in those topics. Below is a screenshot of the different topics that can be filtered on:
By leveraging Context Analytics widgets and analyzing social sentiment across securities from different sources, investors can potentially increase returns. For more information, click the button below or email us at ContactUS@ContextAnalytics-AI.com .
