Context Analytics (CA) is the leader in processing and structuring textual data for sentiment analysis. CA ingests data from a variety of sources including StockTwits, a social media platform for investors and traders to share ideas about the market or securities. CA grades the sentiment from StockTwits messages on a scale of -1.000 to 1.000, aggregates them over a 24-hour period, and compares it to a historical baseline of 20 days to create S-Factors. The S-Factor feed is one of Context Analytics' longest-running products and includes the S-Score, which is a description of how positive or negative sentiment is by security.
Our sentiment feed captures hundreds of ETFs in StockTwits conversations daily. For our research, we focus on ETFs where the SV-Score (Standardized Stocktwits Message Volume Score) is greater than 0, indicating conversation on the security is higher compared to its 20-day average. At 3:40 PM, just 20 minutes before market close, we filter the SV-Score and select the top 5 and bottom 5 ETFs based on the S-Score (Standardized Sentiment Score).
Our strategy is simple: we take a long position in the top 5 ETFs – representing the most positively discussed ETFs on StockTwits – and a short position in the bottom 5 ETFs – representing the most negatively discussed. These positions are taken at equal weights, allowing for an equally balanced portfolio. To evaluate the effectiveness of our strategy, we calculate subsequent close-to-close returns for both portfolios, comparing them to the SPY index as a baseline. Additionally, we include a theoretical long-short position to further assess performance.
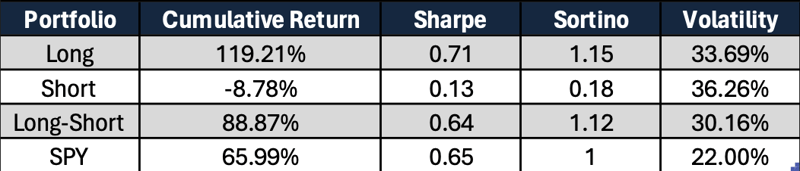
Looking back over the previous four years, our research reveals compelling results. The top 5 ETFs consistently outperform the SPY index by over 50%, showcasing the predictive power of StockTwits sentiment. Conversely, our short portfolio consistently underperforms, losing 8% cumulatively during this period.
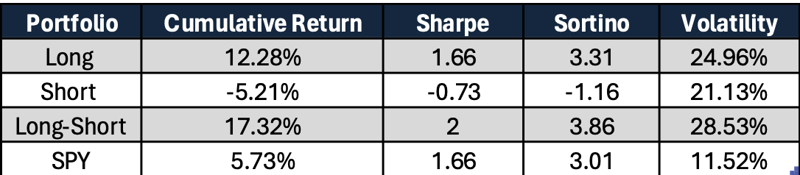
Zooming in on the year-to-date performance, we observe similar trends. The top 5 ETFs outperform the SPY index by over 7%, reaffirming the predictive nature of StockTwits sentiment. Meanwhile, the short portfolio underperforms, trailing the SPY index by 10%.
These findings underscore the significance of StockTwits sentiment as an indicator of ETF price movements. When conversation volume increases on StockTwits, the corresponding sentiment can serve as a valuable predictor of market trends.
For more information on our research and services, visit www.contextanalytics-ai.com or click the button below!
