Fast acting information distributed through social media sites like Twitter can improve investors’ returns. Using Social Sentiment data intraday allows traders to outperform market benchmarks within minutes of information being released.
Context Analytics supplies a suite of Social Sentiment factors describing the tone of conversations as well as overall message volume. As an extension of last week’s blog, we further investigate how a Twitter Social Sentiment based factor changes intraday affects subsequent price movement.
Context Analytics’ social sentiment score is called S-Score which ranges between -4.25 and 4.25. The S-Score is predictive of future price movement when it moves closer to extreme values. This looks at exponentially time-weighted sentiment from Tweets over the last 24 hours and compares it to the daily historical baseline by effectively taking a z-score.
The same calculation is done to compute the SV-Score. This looks at Twitter volume (# of Tweet) on a security over the last 24 hours and compares it to a daily historical baseline. This means when SV-Score is high, there is an abnormally high number of Tweets on a subject. When SV-Score is around or below 0, that means the number of Tweets on a security is about the same or below the historical average.
Using a combination of these two metrics can provide further insights. When Twitter volume on a security is abnormally high and/or there is extreme sentiment, we expect significant price movements in the security. The below formula is how we calculated a combination of these metrics called ‘S-Multi’.

We switch from adding the SV-Score to subtracting it when S-Score is less than 0 because we want to create a uniform factor that has a linear relationship. If there is high Twitter volume and positive sentiment, the S-Multi value will continue to rise. However, if there’s high Twitter volume and negative sentiment, the S-Multi will continue to fall. The idea here is S-Multi will have more extreme values for high volume events (high SV-Score).
The S-Multi value is skewed slightly positive. To have an equal number of events on the positive (Longs) and negative (Shorts) sides, the thresholds are slightly shifted. When S-Multi crosses above 2.5, the security is included in the Longs bucket. When S-Multi shifts below -1.5, it’s included in the Shorts bucket. There is an additional filter of S-Volume > 2, meaning there must be at least 3 Tweets on the security in the last 24 hours to be considered.
Like the analysis in last week’s blog, we look at price returns in 30-minute intervals after the event is triggered. The security’s return is subtracted by SPY’s return over that same period to adjust for different market conditions. We take the average benchmark adjusted return in intervals of 30 minutes for all securities triggered, up to 4 hours or until the day’s market close. The graph below demonstrates to power of S-Multi.
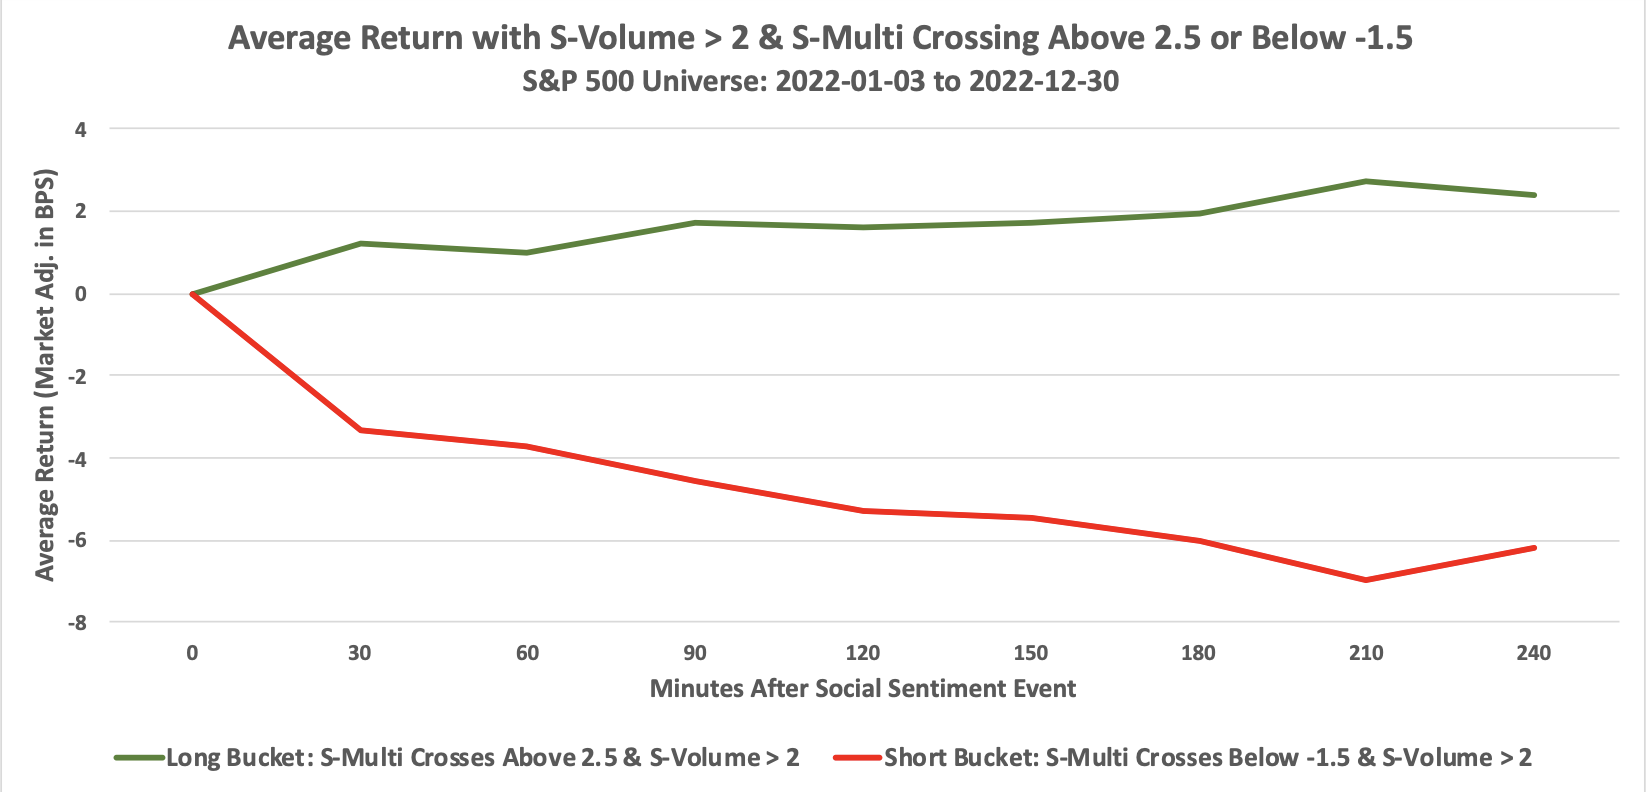
The y-axis is the average return above/below SPY in basis points. The graph shows 240 minutes (4 hours) after the Social Sentiment event is triggered, securities with the positive events outperform the benchmark by 0.024% and negative events underperform by -0.062%. Within 30 minutes of the event, Longs outperform SPY by 0.012% and Shorts underperform by -0.033%. This test was run on Context Analytics’ 2022 dataset and only includes securities in the S&P 500. There were on average 18.6 and 19.3 events in the Long and Short Bucket each day.
Running the same strategy on the first few months of 2023 Social Sentiment data yields similar results. Below is the same analysis and graph on 2023 Context Analytics data.
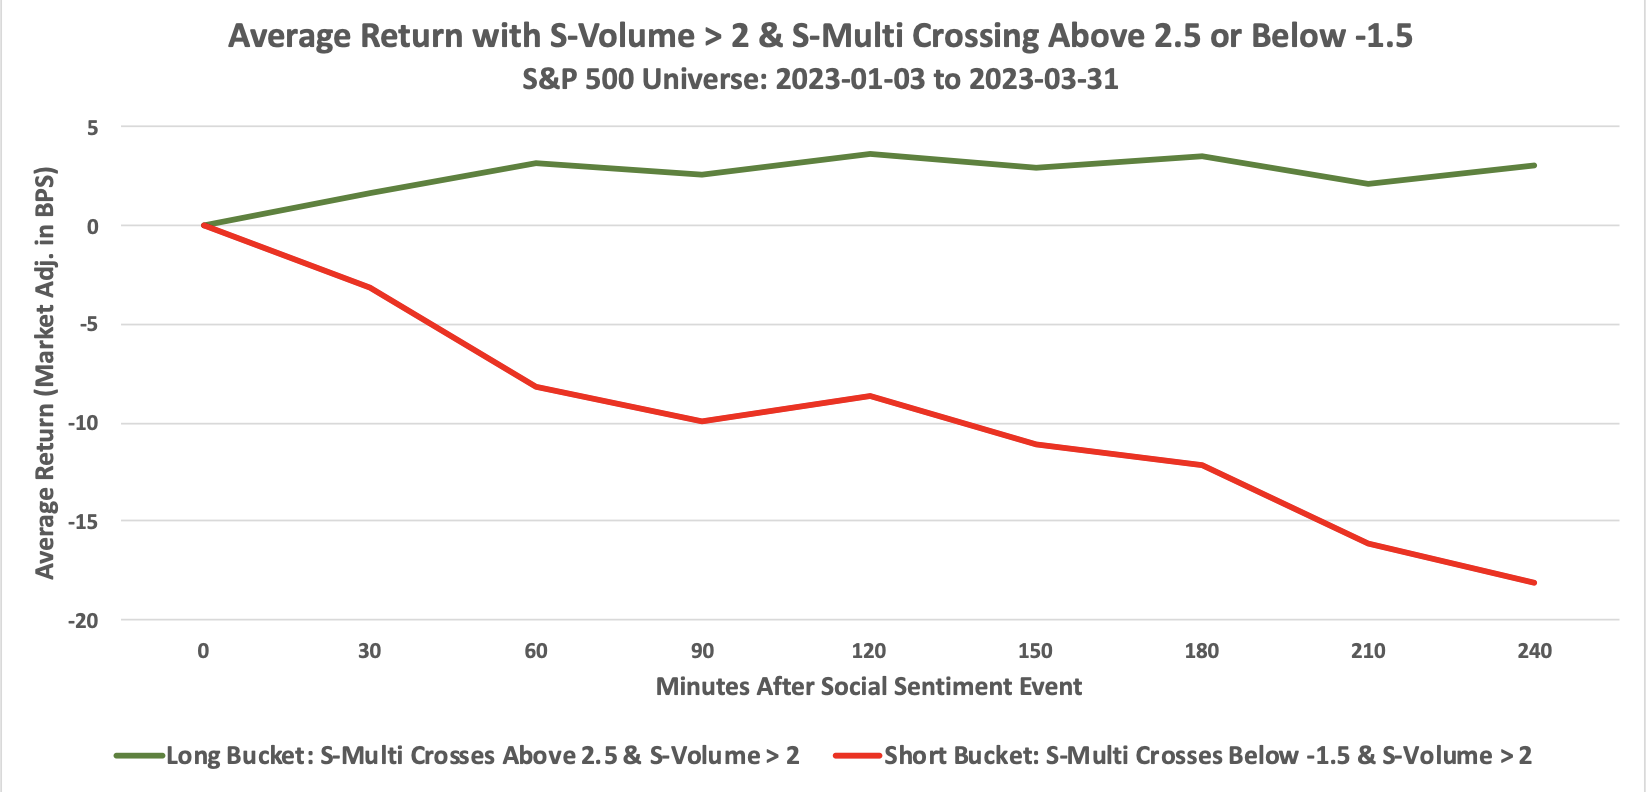
Again, there are on average 18.4 and 19.0 events on the Long and Short Side each day in 2023. This is a similar number to 2022 results, which demonstrates the consistent distribution of this factor. The subsequent return over/under the benchmark is more extreme in the 2023 data. The Short side underperforms SPY by -0.181% after 4 hours of the event occurring while the Long side outperforms by 0.031%.
This combination of Twitter Sentiment and Twitter message volume is accurately capturing extreme values related to information breaking on Twitter and driving price movement. Social Sentiment factors are critical for investors to monitor so they can act on breaking news or shifts in financial markets. Context Analytics metrics are easy to manipulate for the creation of custom factors over your desired time range to match your holding period. For more information, click the button below or email us at ContactUS@ContextAnalytics-AI.com.
