Context Analytics provides predictive Social Sentiment data on ETFs through its S-Factor feed. When overlayed with S-Factor Performance statistics, returns are enhanced by over 4% annually.
Context Analytics covers a variety of asset classes as part of our social media offering, but the ETF asset class gets overlooked due to its risk-adverse nature and non-volatile returns. Context Analytics carries 2250+ ETFs in its universe with roughly 33% of ETFs receiving a signal each day. Tweets from the Context Analytics certified universe of professional investors are used.
Twitter Volume on ETFs tend to be lower than Equities, however the Sentiment signal is just as important. Below is a Close-to-Close Quintiles plot of the ETF asset class with S-Score as its main variable.
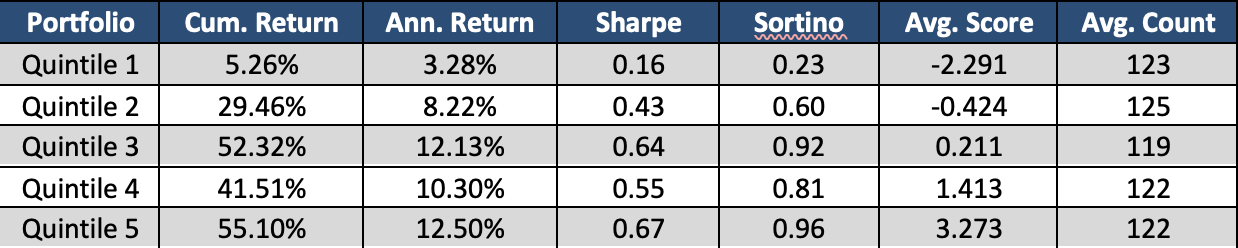
The graph above demonstrates the almost monotonic nature of the data set. The spread between Quintile 1 and Quintile 5 over the 4+ year lookback period is significant and would yield over 9% annually. ETFs with extreme positive sentiment tend to outperform ETFs with extreme negative sentiment on a consistent basis.
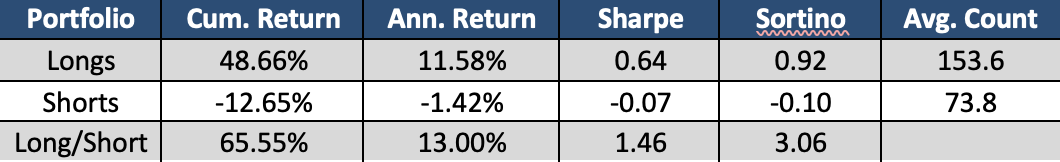
We applied the same factors to a Long/Short strategy, with ETF’s S-Score > 2 in the Long bucket, and ETFs with S-Score < -2 in the Short bucket. Below are the results. Since 2019 there have been over 150 ETFs that have an S-Score > 2 each day, while roughly 75 securities have a S-Score < -2. ETFs with a low S-Score (< -2) significantly underperform the market as shown with a negative cumulative return over a 4+ year period. The spread between the Long and Shorts portfolios is consistent across time and provide a capable market-neutral strategy. The Sharpe ratio of 1.50 is significantly higher than market benchmarks over this same period.
We next applied a filter on the ETFs placed in the Long and Short Portfolio based on the ETF’s historical performance. If a security typically isn’t predictive when its S-Score is above 2 or below -2, it will be excluded from the portfolio. We take a lookback period of 1 year and look at the win rate and average price return of an ETF when it’s S-Scores are greater than 2 or less than -2.
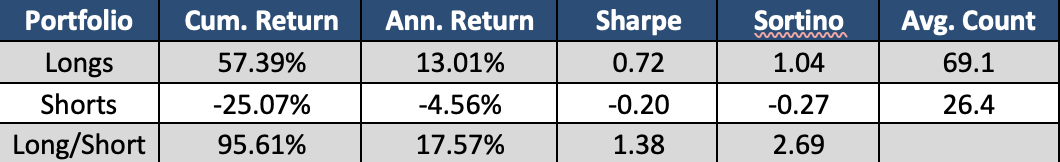
By applying a filter of Win Rate >= 50% and the mean return being positive for the Long portfolio and negative for the Short Portfolio, the Long/Short portfolio’s return enhanced significantly. An increase of over 4.5% annually in the Long/Short portfolio demonstrates the importance of looking at historical S-Score performance statistics.
ETFs don’t have the price jumps like Equities or Cryptos, however these securities do have enough volatility to generate alpha. Social Sentiment is one of the ways to uncover alpha amongst ETFs.