This blog explores Context Analytics’ Social Media Sentiment Feed, and how it could be used for day trading. In many of our previous blogs, we demonstrate the predicative power of S-Score, a sentiment metric which tells a user the current sentiment over the past 24 hours compared to a baseline of 20 days. S-Score could be paired with a variety of other S-Factors (s-volume, sv-score, s-dispersion, s-buzz, etc.) to create a complete view of a security’s social media activity.
In this analysis, we use a derivative factor from S-Score. Instead of taking the S-Score, we look at the change in the S-Score over the previous 24 hours. The rationale behind using this factor is to account for the previous days’ Sentiment and performance, and capture any ‘mean reverting’ price action. This factor also would capture any emerging conversations which significantly move a security’s sentiment.
This change in S-Score is multiplied by S-Buzz, which is a measurement of the stock’s Twitter volume compared to the entire US Equity universe. The minimum value of S-Buzz is 0 while its average value is 1. This means any security that has above average conversation level (S-Buzz > 1) will have a larger magnitude on the change in Sentiment Score, while securities with less than average Twitter conversation (S-Buzz < 1) will have a reduced value on the change in Sentiment Score. Here is the formula for the factor, where t is today’s date:
![]()
Since this value is a measurement of daily changes in Sentiment, we decided to predict daily Close-to-Close returns in the form of quintiles. We use our pre-close (3:40pm ET) sentiment values to calculate metrics and execute theoretical trades on the close. Quintiles bucket securities into 5 groups each day based on the value we are testing. We take the mean return from each bucket every day and cumulate returns over time. The idea is the bucket with the most positive sentiment values (Quintile 5) outperform the rest of the buckets while the most negative sentiment values (Quintile 1) underperform the rest. Below are the results:
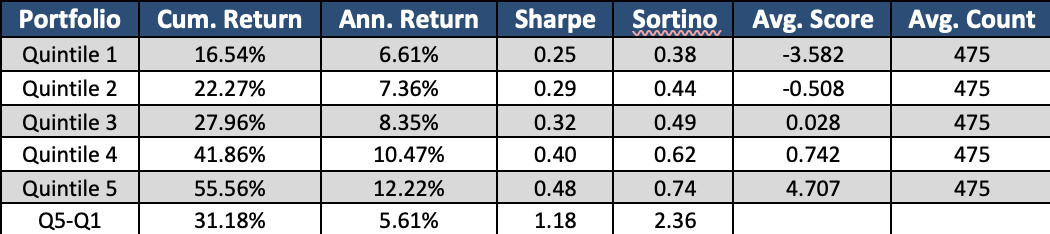
The Universe used in this analysis includes all stocks that have Price > $5 because we wanted to remove any low float or penny stocks that can have extreme volatility. The universe covered is large, as over a ~5 year period there are on average 2,375 stocks with a signal each day.
With this broad of a universe, the data demonstrates the predictive and monotonic nature of this derivative factor. Quintiles are aligned in proper order, even in Quintiles 2-4 where the average value of the derivate factor ranges from -0.508 to 0.742. Additionally, the spread between Quintile 5 and Quintile 1 produces a steady return over a ~5-year period with a Sharpe ratio of 1.18.
Context Analytics’ S-Factor feed is our oldest and most mature product. Our offering of 10+ years of out-of-sample data and our 15 different sentiment factors makes this dataset unique and ideally suited for back testing. With this dataset, users can harness the power of social media in financial markets by creating derivative factors or aggregating factors over longer periods of time to suit their ideal holding periods.