Social Sentiment can be leveraged to enhance stock selection and identify price movements. Using metrics from Context Analytics, customers can utilize metrics like S-Score and S-Buzz to create strategies with reduced risk.
One of Context Analytics' (CA) most popular metrics is the S-Score, a valuable tool for assessing sentiment within current conversations in relation to a stock's historical baseline. CA leverages its proprietary Natural Language Processing (NLP) capabilities to score sentiment, aggregating messages over specific timeframes while also calculating historical means and standard deviations. The S-Score is essentially a z-score derived from these sentiment values.
When the S-Score registers higher, it indicates that the sentiment from the prior day surpasses the sentiment from the previous 20 days. This elevated S-Score signifies positive sentiment, suggesting that the security is likely to outperform the broader market. Conversely, when the S-Score is lower, it signifies that sentiment on Twitter is below the usual levels, and in such cases, we expect the security to underperform the market.
S-Buzz is another noteworthy metric that quantifies the level of activity surrounding a particular security relative to the broader discussion of securities. A typical S-Buzz value stands at 1. If the S-Buzz falls below 1, it implies that there is less volume of discussion than usual, while an S-Buzz exceeding 1 indicates heightened conversation compared to the norm.
These two factors are integrated by multiplying them to create a novel composite factor that combines both sentiment and message volume. These metrics are evaluated using StockTwits messages, a platform where investors and traders share their insights.
The combined factor is calculated just before the market closes each day, and trading decisions are made for the subsequent close-to-close period. In our strategy, any securities within our universe that receive three or more messages meeting the criterion of S-Score * S-Buzz >= 2 are added to the Longs portfolio. Conversely, securities with a product of <= -2 are included in the Shorts portfolio. The allocation within each portfolio is equal-weighted, ensuring that every security carries the same weight in the portfolio. The theoretical Long/Short portfolio is then constructed by maintaining an equal balance between the Longs and Shorts, allowing for a balanced and risk-managed approach to trading.
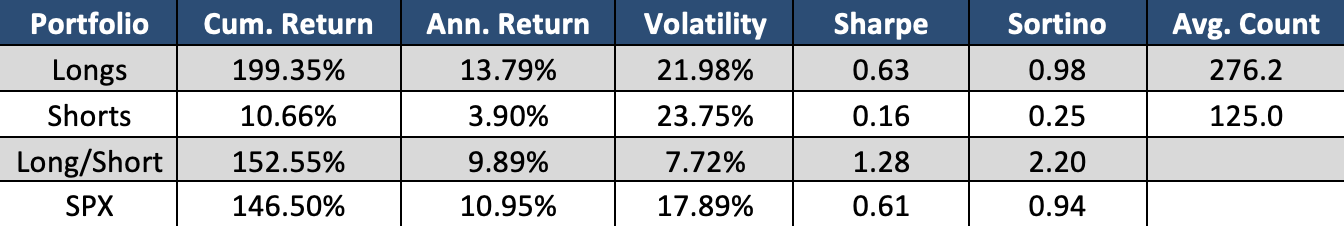
Since 2014, our strategy has consisted of an average of 276 securities meeting the Longs criteria and 125 on the Shorts side. Over this period, the Long/Short portfolio has delivered cumulative returns that surpass the benchmark while simultaneously reducing overall risk by more than half. This impressive performance is reflected in the Sharpe ratio, which stands at 1.28, more than double the SPX's Sharpe ratio of 0.61. This factor is a valuable tool for pinpointing securities that are likely to underperform the broader market.
The portfolio exemplifies how leveraging social sentiment metrics can substantially enhance stock selection, resulting in higher returns and a reduction in overall risk. Context Analytics offers a plethora of sentiment metrics from various sources, each contributing to a comprehensive toolkit for making informed investment decisions. For further insights into Context Analytics, please click the button below or reach out to us via email at contactus@contextanalytics-ai.com.
