Traders utilize sentiment factors from both Twitter and StockTwits to confirm social sentiment or identify high message volume securities. Using sentiment from two unique sources provides a strong signal. A sample long only portfolio with no overnight position yields cumulative returns greater than 70% since the beginning of 2022.
Context Analytics is an official partner of Twitter and the exclusive distributor of StockTwits data. We calculate sentiment on messages from these two sources in individual data feeds. In this blog we explore how you can utilize metrics across Twitter and StockTwits to create a predictive trading strategy. Context Analytics’ S-Factors are calculated the same way across Twitter and StockTwits. The only difference between the two data feeds is the raw textual data from the messages posted on the two platforms.
As part of this Long only portfolio, we wanted to identify which securities on the day will have abnormal returns. One way to decipher volatile securities is by looking at SV-Score, which is message volume on a standard normal curve. It tells you which securities have unusual high or low message volume compared to it’s historical baseline. When SV-Score is high, there is currently high message volume and something is happening in these securities.
To capture these securities in the portfolio, Twitter and StockTwits’ SV-Score >= 1.5 is a rule. By using both Twitter and StockTwits, the user is confirming two social media sources have abnormally high chatter for this security.
After limiting the universe of securities to abnormally high-volume stocks, we look at S-Score to determine if that message volume is positive or negative. Because this portfolio is specifically looking at the long side, we want to select positive sentiment securities.
We created two portfolios, grouping sentiment differently in each. One portfolio only includes securities if both Twitter and StockTwits have a S-Score >= 1.5. The other portfolio takes the average between the two S-Scores and only includes it if the Avg. S-Score >=1.5.
In this daily strategy we use a universe of securities with Price > $5 to exclude penny stocks and securities with volatile price movement. We take the sentiment metrics 20 minutes prior to Market Open (9:10 am ET) to determine positions. Below is a graph of an Open-to-Close daily rebalanced cumulative returns using the two strategies.
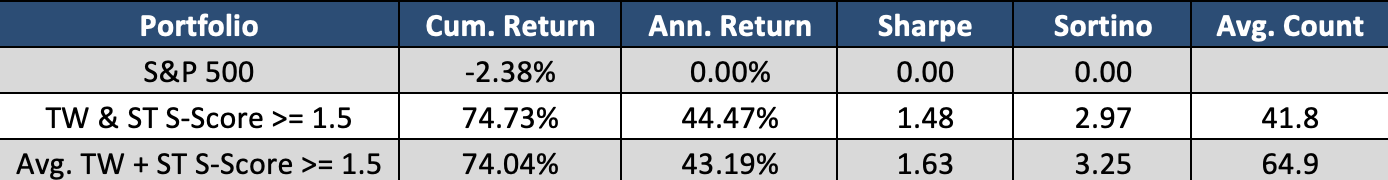
On average there are 41.8 securities each day with SV-Score and S-Score >= 1.5 on both Twitter and StockTwits. When trading these securities from Market Open to Market Close equally weighted each day, the portfolio returns nearly 75% in 17 months. Meanwhile, the S&P 500 has decreased over that same period.
Using a more conservative approach to security selection by taking the average S-Score of Twitter and StockTwits >= 1.5 yields nearly the same results. The average number of securities traded each day increases 55% to 64.9 securities each day, but the cumulative portfolio returns are nearly the same. With more securities, the portfolio’s volatility and risk decreases, thus enhancing the portfolios Sharpe and Sortino ratios.
Using two unique Social Sentiment sources can enhance a trader’s stock selection and decision making. Context Analytics partnerships with Twitter and StockTwits enables users to ingest both sources using the same proprietary technology. There are many other ways to utilize these unique datasets. For more information, click the button below or email us at ContactUS@ContextAnalytics-AI.com.
