Bitcoin (BTC) and Ethereum (ETH) are the two largest cryptocurrencies by market capitalization. One advantage to trading these two cryptocurrencies is the liquidity, allowing investors to be in and out of positions quickly with the ability to short the asset.
The purpose of this research is to use the real time sentiment metrics from Context Analytics to improve the returns of trading these two cryptocurrencies. Context Analytics calculates sentiment data on over 700 cryptocurrencies from real time Twitter conversations. The hypothesis is sentiment of the entire cryptocurrency market on Twitter combined with the individual coin’s raw sentiment can be predictive of performance in Bitcoin and Ethereum.
The first metric used takes the hourly change in raw sentiment (Raw-S) for each coin. We will call this RawDelta and the formula is as follows (where h is the hour):
Context Analytics also produces a metric called the Crypto Market Indicator (CMI) which is a standardized sentiment score across the entire cryptocurrency asset class. We aggregate the raw sentiment from all coins over the last 24 hours each day to aggregate to a daily sentiment value. We then calculate a 14-day rolling sum of the sentiment values and compare it to a 60-day baseline to generate the CMI. The CMI is a standardized score with a 14-day summation of Twitter sentiment for all coins in our universe and compared to a 60-day baseline. The mathematical formula for the standardized score is written as follows (where d is an index for the day and Score is the aggregate score of each day calculated every hour):
This score is updated every hour, changing very marginally given the large summation and standardized period. To isolate the hourly change in sentiment, we created a variable to capture the change in score for the hour before entering the market. The change in sentiment is calculated by the following (where h is the hour):
We will base the bandwidths of our decisions on the distributions of the metrics. The histograms for the three variables are shown below:
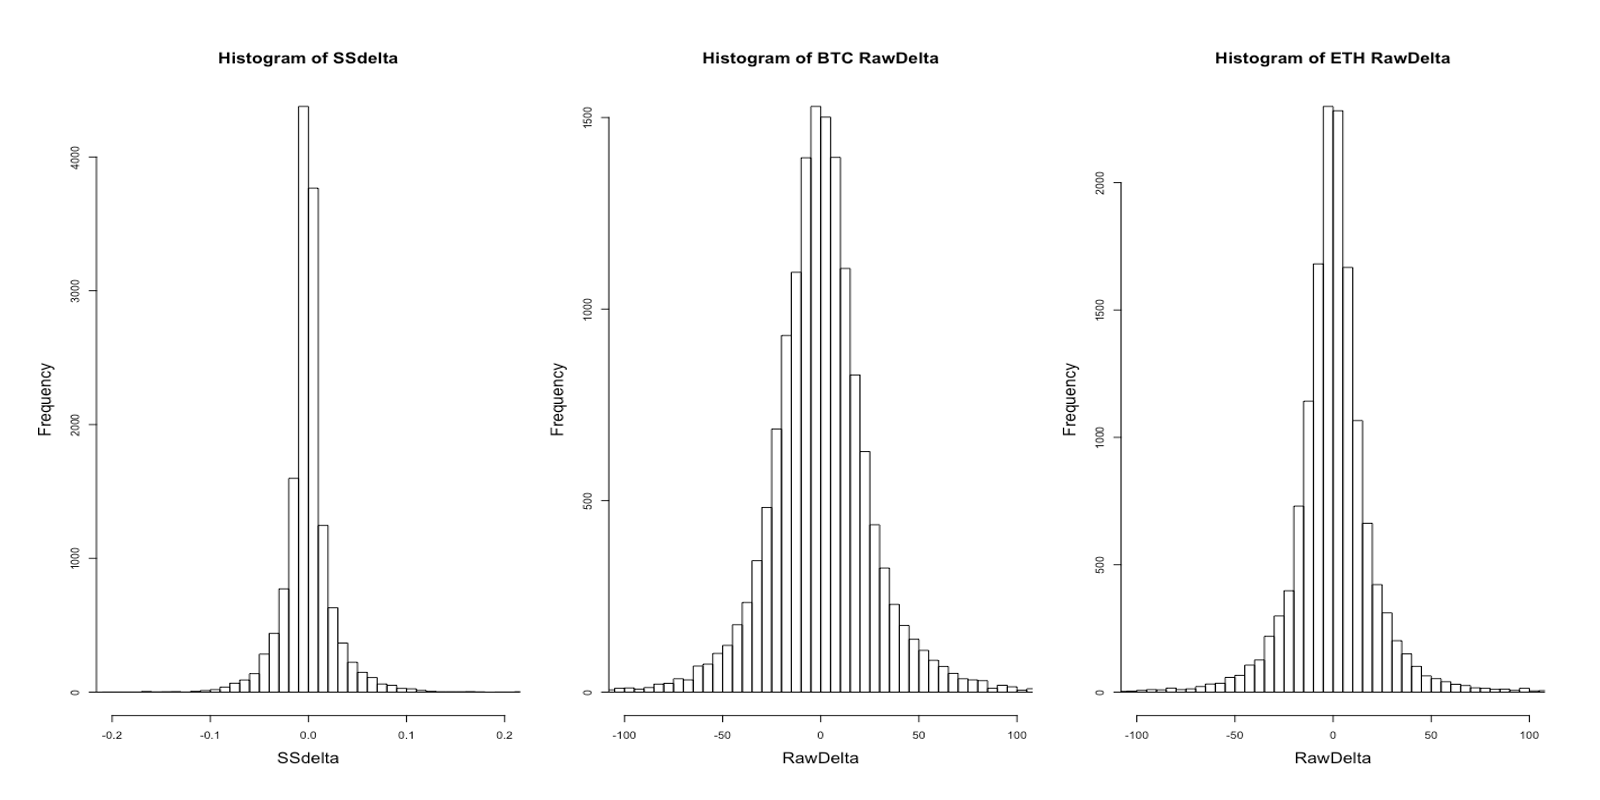
The histograms suggest the measures of extreme positive/negative signals. With the two metrics we will construct a decision tree that indicates the size of our position for each hour. Using the RawDelta for each coin, we will decide whether to enter a strong position. Following this decision, we use the crypto market indicator to determine the magnitude of the position. The diagram of the tree is shown below:
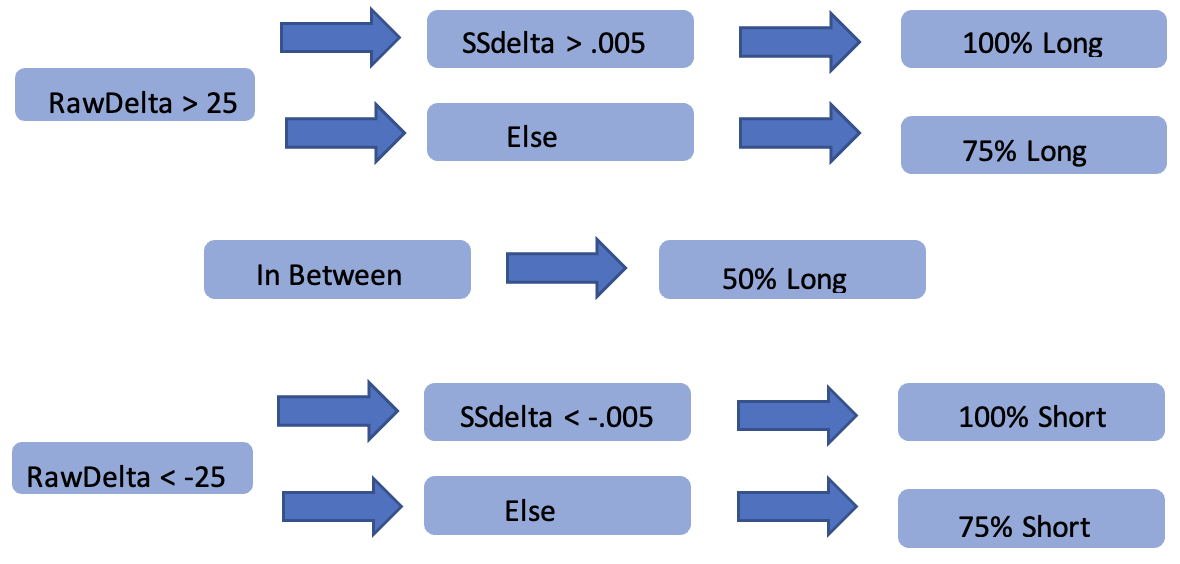
The in between position suggests that we don’t have a firm signal and will long half our normal amount to minimize risk. Using this hourly strategy, we traded on both Bitcoin and Ethereum from the beginning of 2021 to early 2023.
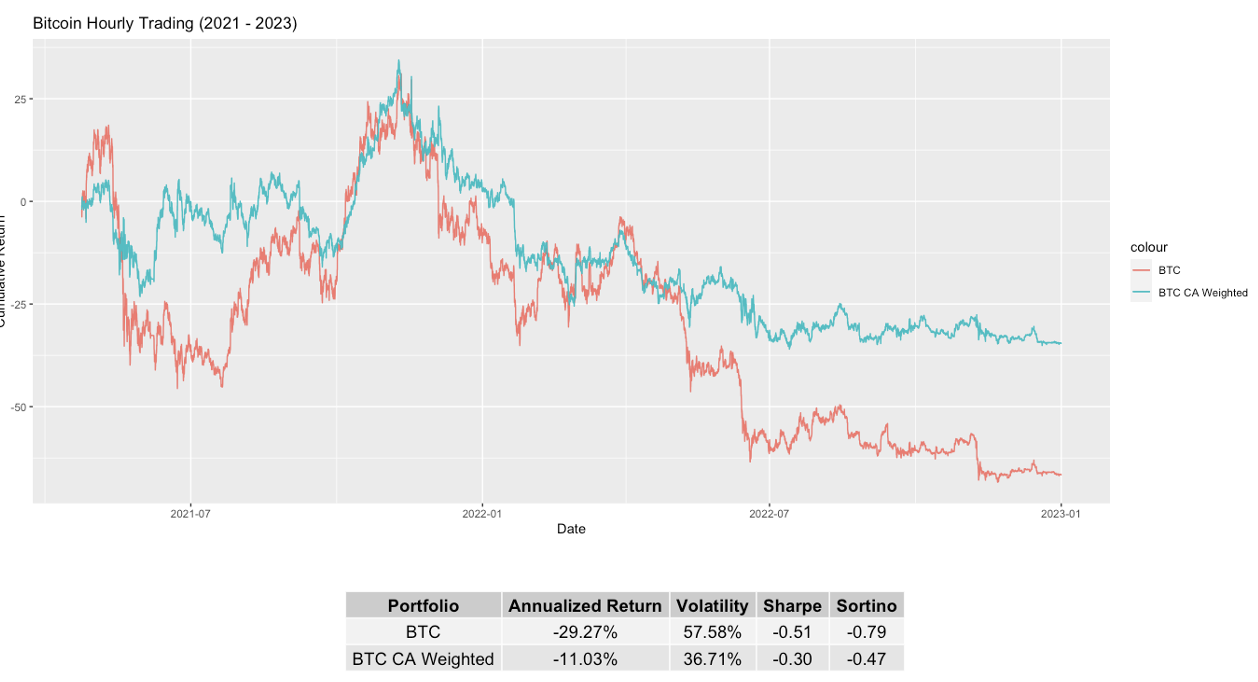
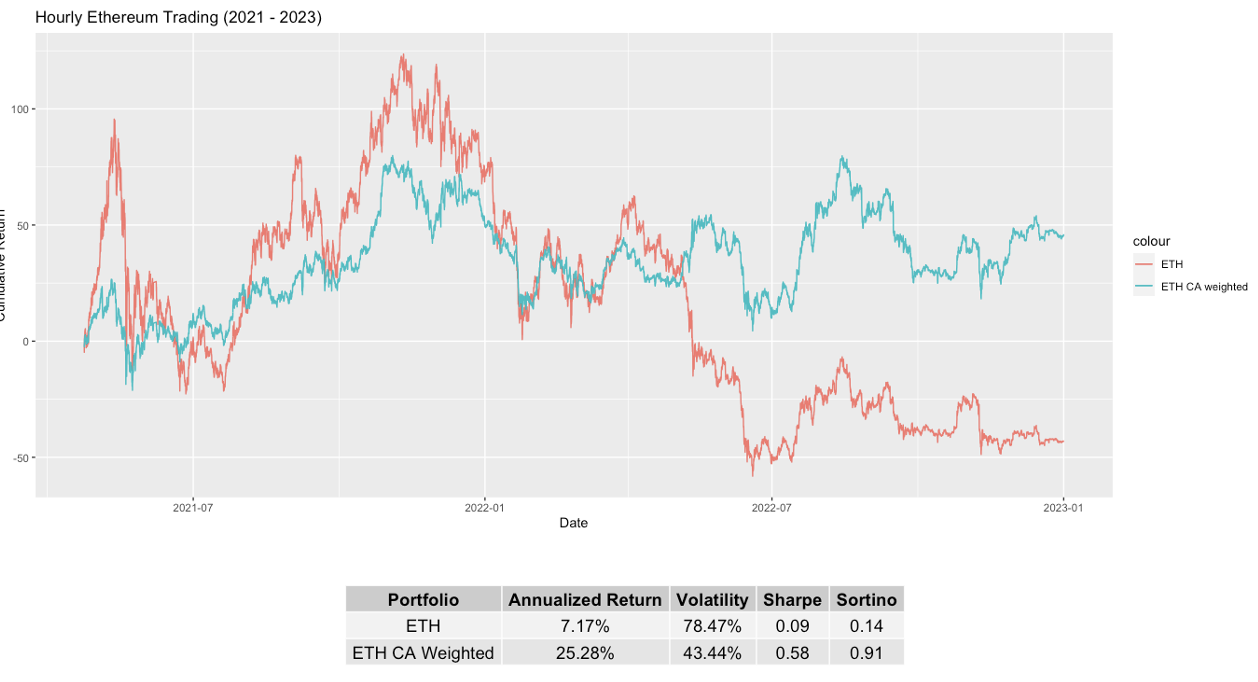
The time series graph shows an improvement in performance for both Bitcoin and Ethereum. Albeit negative, Context Analytics metrics increased a poor performing Bitcoin by 18% annually while decreasing volatility. The strategy performed very well for Ethereum. The cumulative return increased by close to 80% and the risk metrics improved greatly. The summarizing metrics show that the Context Analytics weighted positions not only increased returns, but lowered volatility and risk over the trading period. This gives sufficient evidence that the sentiment on all cryptocurrencies through Context Analytics can be used to improve Bitcoin and Ethereum performances. With such volatile assets, using sentiment can provide a signal to lower risk in trading decisions. There are many other applications of cryptocurrency sentiment to improve decision making. For more information, click the button below or email us at ContactUS@ContextAnalytics-AI.com.
