Context Analytics daily sentiment Long/Short portfolio without overnight risk yields 80% return since the beginning of 2022. When overlayed with historical security performance statistics, that adds over 25% to its cumulative return over this period.
A few weeks ago, we wrote a blog updating Context Analytics’ longest running sample strategy. The strategy looks at securities with an S-Score >= 2 or S-Score =< -2 prior to Market Open (9:10am ET). S-Scores are Z-Scores that detect Twitter sentiment. An S-Score > 2 means the conversation over the last 24 hours is 2 standard deviations more positive than it has been over the last 20 days. This is considered bullish for the stock price, and on the opposite end, a S-Score < -2 is considered bearish for the stock price. Only Tweets from our influential universe of Twitter accounts are aggregated into S-Scores every minute. These portfolios are shown in the graph below as ‘Longs’ and ‘Shorts’ with the combined portfolio being ‘Long/Short’.
We also overlayed historical performance statistics with the S-Score to create a subset of the portfolios. The historical performance statistics looks at the win rate and average price return by security over the past 1 year when S-Score is above 2 or below -2. The accuracy filter applied to the portfolio below is the historical average daily return of the security must align with the graded sentiment. Below are the criteria for each portfolio:
Longs : S-Score >= 2
Longs w/ Acc : S-Score >= 2 & Average Daily Return over last year when S-Score above 2 > 0
Shorts : S-Score =< -2
Shorts w/ Acc : S-Score =< -2 & Average Daily Return over last year when S-Score below -2 < 0
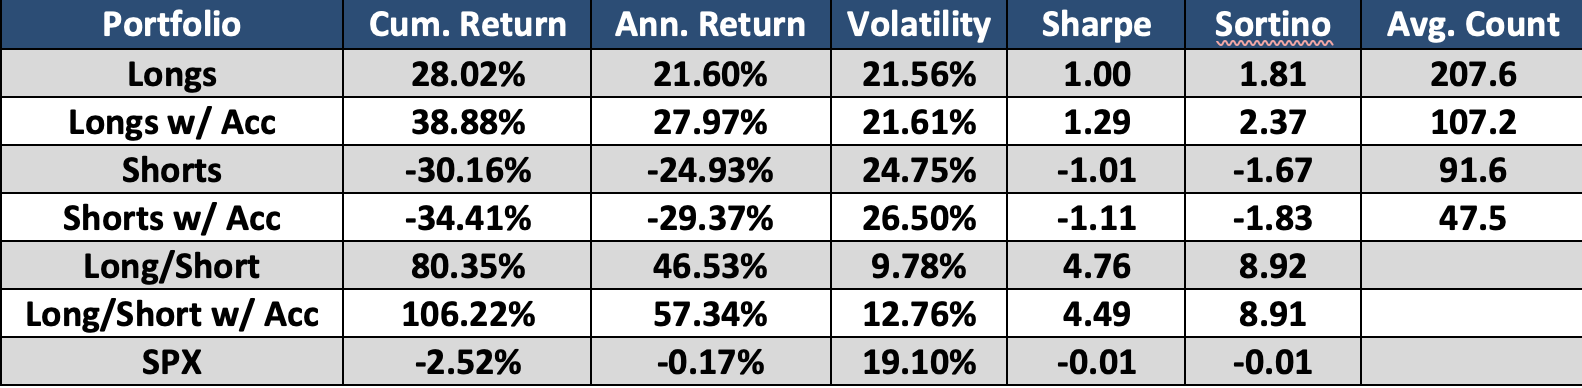
The additional accuracy filter of the historical performance makes large changes to both the Long and Short portfolios. It yields good results on both sides (Longs annualized return increased and the Shorts annualized returns decreased) while reducing the number of securities in each bucket significantly. The Longs portfolio when from 207 securities to 107 when applying the mean daily return filter. Shorts portfolio decreases from 91 to 47. That’s a near 50% decrease in the number of securities traded.
These performance statistics are meant to help identify which securities react best to Social Sentiment data. By identifying which securities perform best and leveraging that information to make informed trading decisions is a great way to utilize Context Analytics data. There are many other applications of using sentiment metrics to improve decision making in the stock market. For more information, click the button below or email us at ContactUS@ContextAnalytics-AI.com.
