Intro: Context Analytics has developed its S-Factor and Activity feeds on TSX securities sourced from StockTwits messages. This aggregates StockTwits conversations on Canadian securities using our patented NLP. From a historical backtest, over the past 4+ years, the spread between TSX securities in the highest and lowest S-Score quintile yields a return of over 140%.
Context Analytics (CA) has a suite of products, one being social sentiment feeds sourced from StockTwits messages. In partnership with StockTwits, CA expanded its coverage on topics to include Canadian Securities. Using proprietary Natural Language Processing (NLP), Context Analytics develops a group of factors describing the tone and level of conversation at the security level.
To develop a historical baseline and test these metrics, Context Analytics pulled messages from StockTwits and calculated S-Factors. S-Score is one of many factors and is a Z-Score that detects sentiment from StockTwits. An S-Score > 2 means the conversation over the last 24 hours is 2 standard deviations more positive than its previous 20 days. This is considered bullish for the stock price. A S-Score < -2 is considered negative sentiment and bearish for the stock price.
The graph below splits securities into 5 buckets, quintiles, each day before market close. Each quintile’s return is the average subsequent Close-to-Close return of securities placed in that bucket. Securities in Quintile 5 have the highest S-Score, as seen with the average S-Score of Quintile 5 being 2.867. Quintile 1 are the securities with the most negative sentiment with the average S-Score being -1.645.
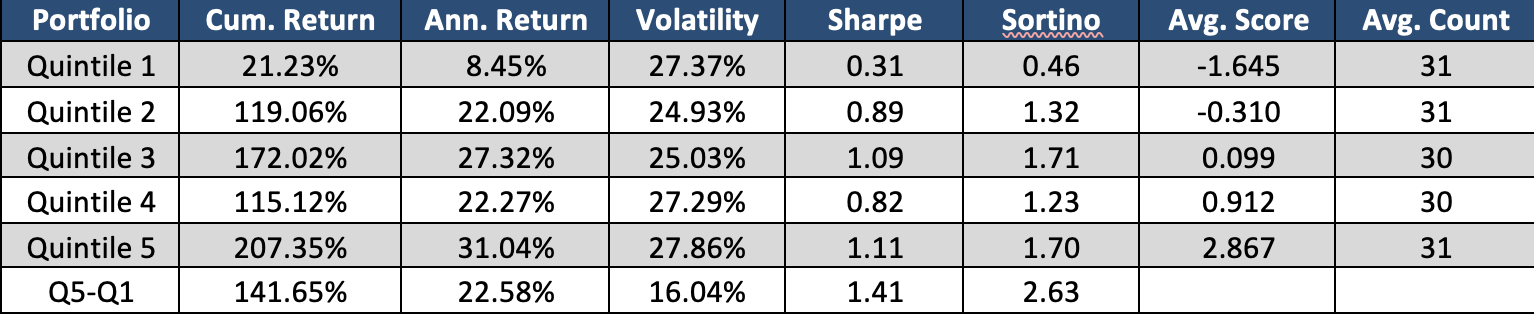
The green line shows Canadian stocks with high StockTwits sentiment tend to outperform the TSX market. While the red line shows negative sentiment securities underperform. There are roughly 30 securities in each bucket every day which is a reasonable size over this time range. The spread between Quintile 5 and Quintile 1 is quite large and leads to a cumulative return of over 140% in the 4+ year time range. The Sharpe ratio of 1.41 shows the reduced risk in the portfolio too. There are many other applications of using sentiment metrics to improve decision making in the stock market.
In addition to sentiment on TSX securities, Context Analytics has partnered with TMX to create a one-of-a-kind company level textual analytics tool. TMX Contextual Analytics allows for instantaneous analysis of all filings on companies covering global securities. All filings types, sentiment, and powerful search capabilities are immediately available for analysis and alerting.
For more information, click the button below or email us at ContactUS@ContextAnalytics-AI.com.
