Context Analytics’ Social Sentiment has been predictive over the last 10+ years. This blog explores the monotonic relationship between Social Sentiment and subsequent price action on US Equities.
Context Analytics is the leader in processing and structuring textual data for sentiment analysis. One of the longest-running products is the Context Analytics S-Factor feed. The S-Factor feed is a suite of metrics that describe Social Sentiment from Twitter and StockTwits messages separated by source.
On Twitter, Context Analytics has its proprietary account rating algorithm that grades accounts based on a variety of factors relating to financial Tweets. If an account passes the algorithm, then its Tweets are included in the S-Factor metrics moving forward. On Stock Twits, all accounts are included in the metrics as people who are active on the platform only discuss financial topics.
Context Analytics has topic models for each individual security, which is a collection of rules that are company identifiers. This allows us to know which messages reference which companies. Messages that match any topic model rule is ingested and graded on sentiment from a scale of -1.000 to 1.000. Message sentiment and count are aggregated over a 24-hour period and compared to a historical baseline of 20 days to create S-Factors. These factors are updated every single minute.
The S-Score, one of many S-Factors, is an exponentially weighted summation of sentiment from messages on a security in the past 24-hours (`S`) compared to the mean (`SMean`) and standard deviation (`SVolatility`) from the previous 20 days. Sentiment is exponentially summed so messages from a few minutes ago hold more weight than messages from 23 hours ago. This gives a cross-sectional view of Social Sentiment without bias towards message volume because the security’s sentiment is being compared to its historical baseline. Below is a formula for calculating S-Score as well as the general distribution of S-Score.
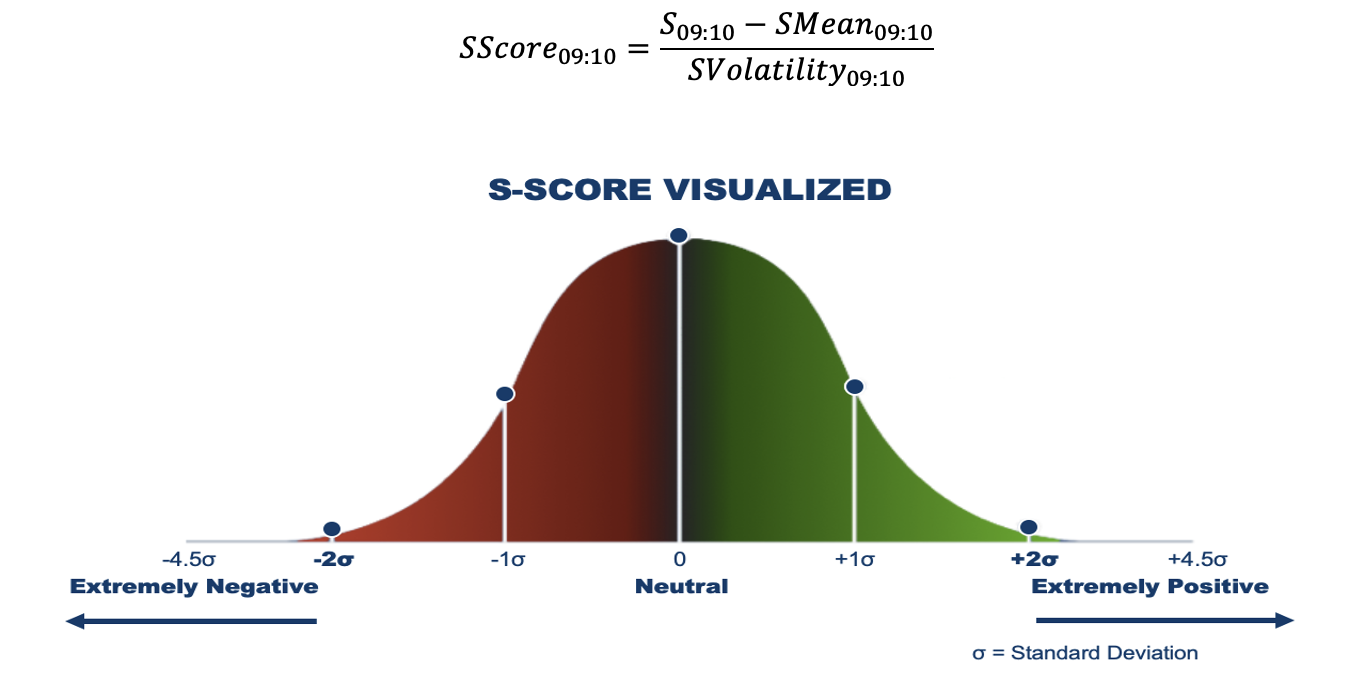
S-Score informs the user if Social Sentiment is abnormally high or low for any security. Many securities are neutral (between -1.000 and 1.000). However, when securities shift to extremely positive (2.000) or negative (-2.000), that’s when the predictive power of the Sentiment is influential. Securities exhibiting abnormally high sentiment are expected to outperform their peers, while securities displaying abnormally low sentiment are expected to underperform.
To demonstrate this relationship, we decided to group securities into daily quintiles and plot cumulative price returns. This was run on a universe of stocks covered by Context Analytics and have a share price greater than $5. This is to exclude any penny stocks with drastic returns.
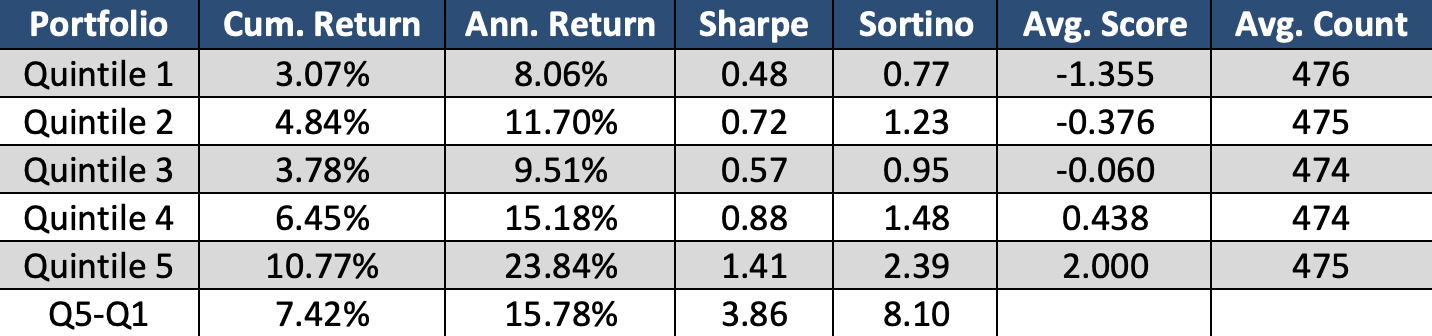
Before market open, at 9:10am ET, we grab all securities with a S-Score published. These securities are bucketed into daily quintiles based on the value of S-Score. Each day the highest 20% of S-Scores are grouped in quintile 5, the next highest 20% in quintile 4, and so on until the bottom 20% of S-Score are in quintile 1. We then calculate the Open-to-Close return of each individual stock and equally average the return by quintile and date to have a portfolio return for each quintile/date combination. Below is the plot of the cumulative return of these quintiles over the last 10+ years from Twitter and StockTwits.
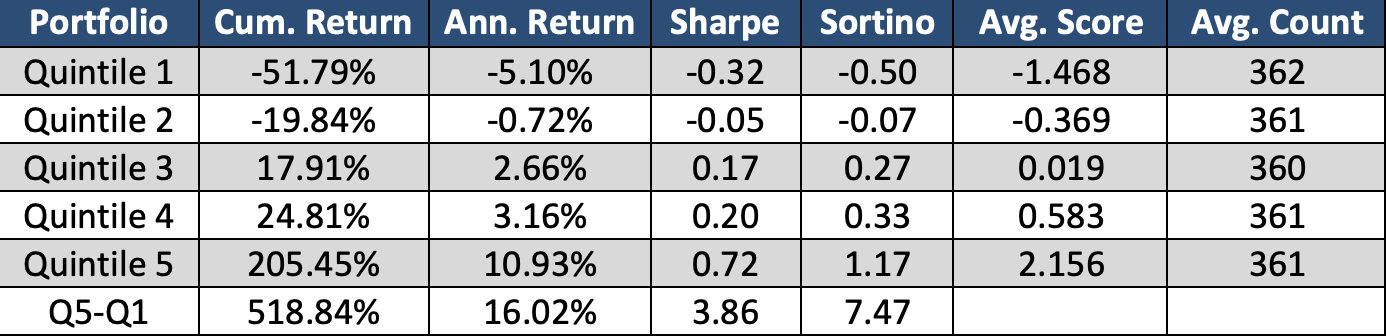
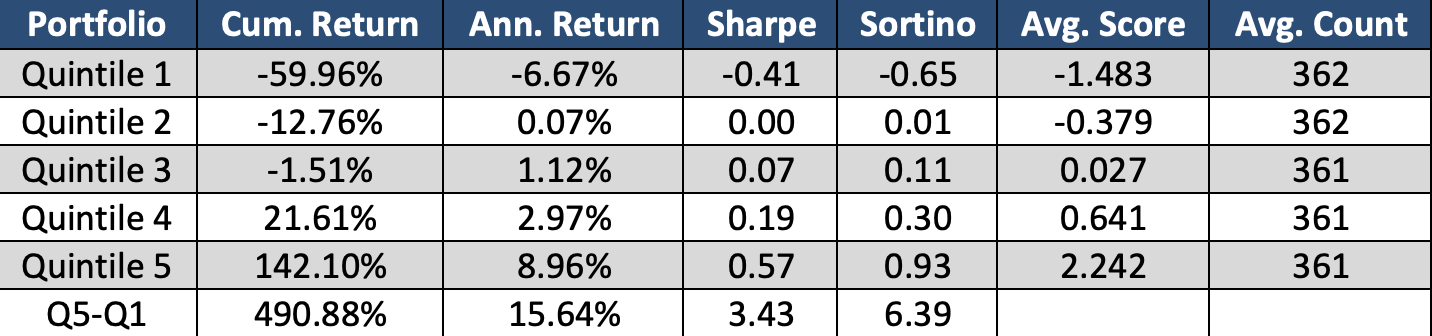
There is a clear relationship between S-Score the subsequent Open-to-Close return in the graph above. As S-Score increases, it is more probable the security’s return will outperform the market. Inversely, as the S-Score decrease, it is expected the return will underperform.
These graphs are on 10+ years of historical data. Each day there is on average over 1,800 securities with a S-Score from Twitter and StockTwits that have a share price greater than $5. The breadth of the signal demonstrates how this is robust over multiple market caps and industries.
The spread between quintile 5 and quintile 1 has outperformed the market significantly with very little risk. The S-Score is a great tool for any Long/Short trader looking for a systematic strategy or new trade ideas.
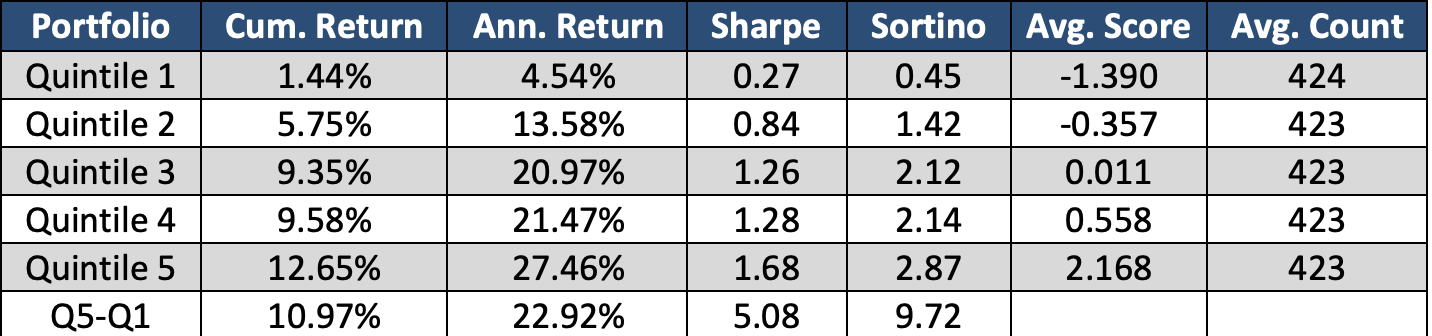
The plots below are the same as above, however its only on data from 2023. These year-to-date graphs show the S-Score is still predictive in recent markets despite the general investor being more aware of Social Sentiment.
Context Analytics’ S-Factor feed is the company’s most mature product. Our offering of 10+ years of sample data and 15 different sentiment factors makes this dataset unique and ideal for back testing. With this dataset, users can harness the power of social media in financial markets. For more information, click the button below or email us at ContactUS@ContextAnalytics-AI.com.
