Context Analytics’ Social Sentiment Score, S-Score, has been a consistent predictor of excess return and underperformance over the sector average over the last 10 years.
We previously showcased how Context Analytics’ S-Score is predictive on an individual security basis. In this blog we explore how that signal performs by sector.
Similar to previous analysis, we look at the S-Score 20 min prior to market open (9:10 ET), and group securities into Long and Short buckets when the S-Score is > 2 and S-Score < -2, respectively. We take the average Open-to-Close returns from securities and cumulate returns over time. The table below takes the annualized return over the period (December 1, 2011 to April 21, 2023) for each sector and the number of securities in each group. Securities must have Twitter conversation (S-Volume >= 1) and have a Price > $5 to be included in this universe.
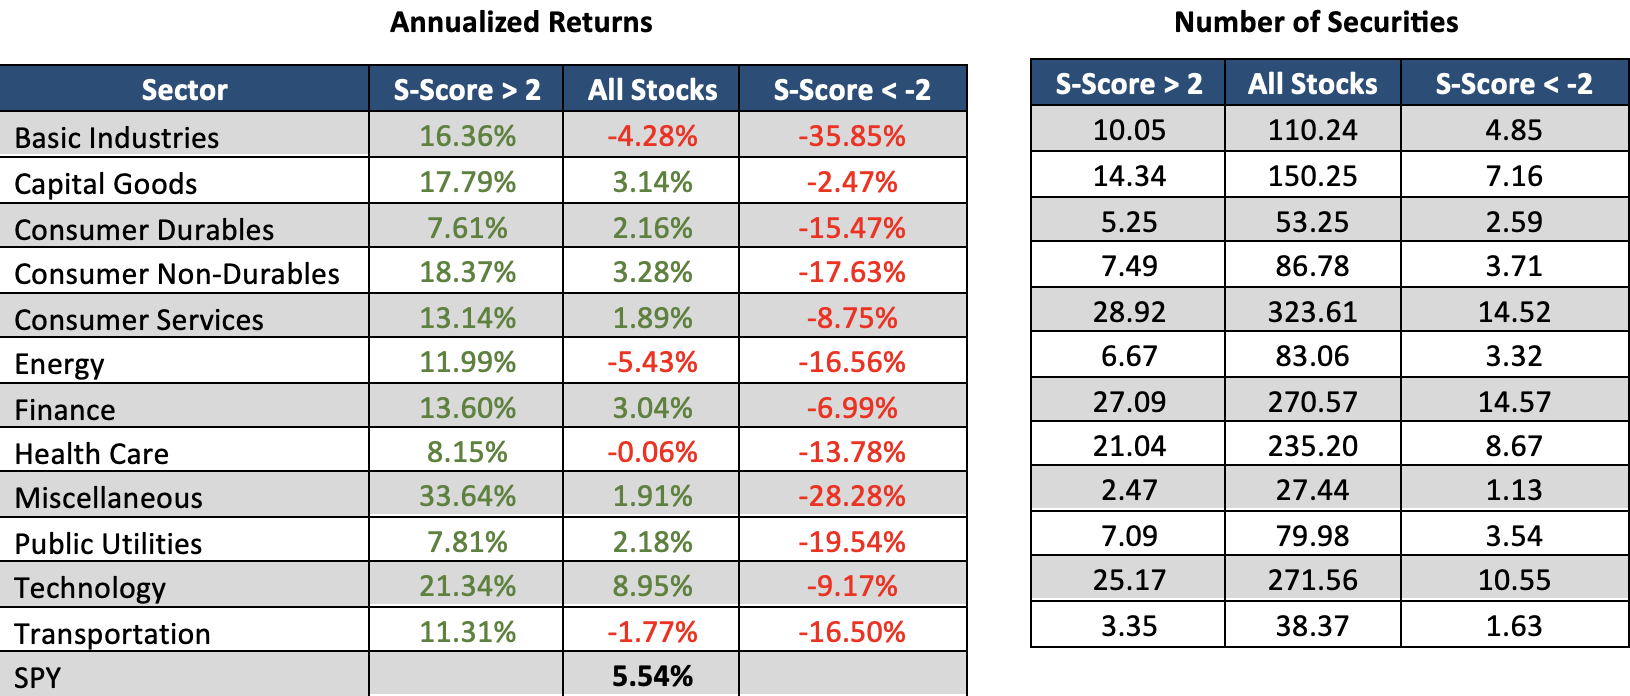
The annualized returns table above shows S-Score > 2 outperforms All Stocks within each sector. Additionally, all S-Score < -2 underperforms All Stocks within the sector. This is taken over a 10+ year history which indicates the robustness of the dataset. Each sector has a different number of securities, so the table above shows the ratio of securities that fall into each sector and how many reach extreme sentiment scores. Consumer Services has the most securities in the sector so below we look at the cumulative return series for this sector.
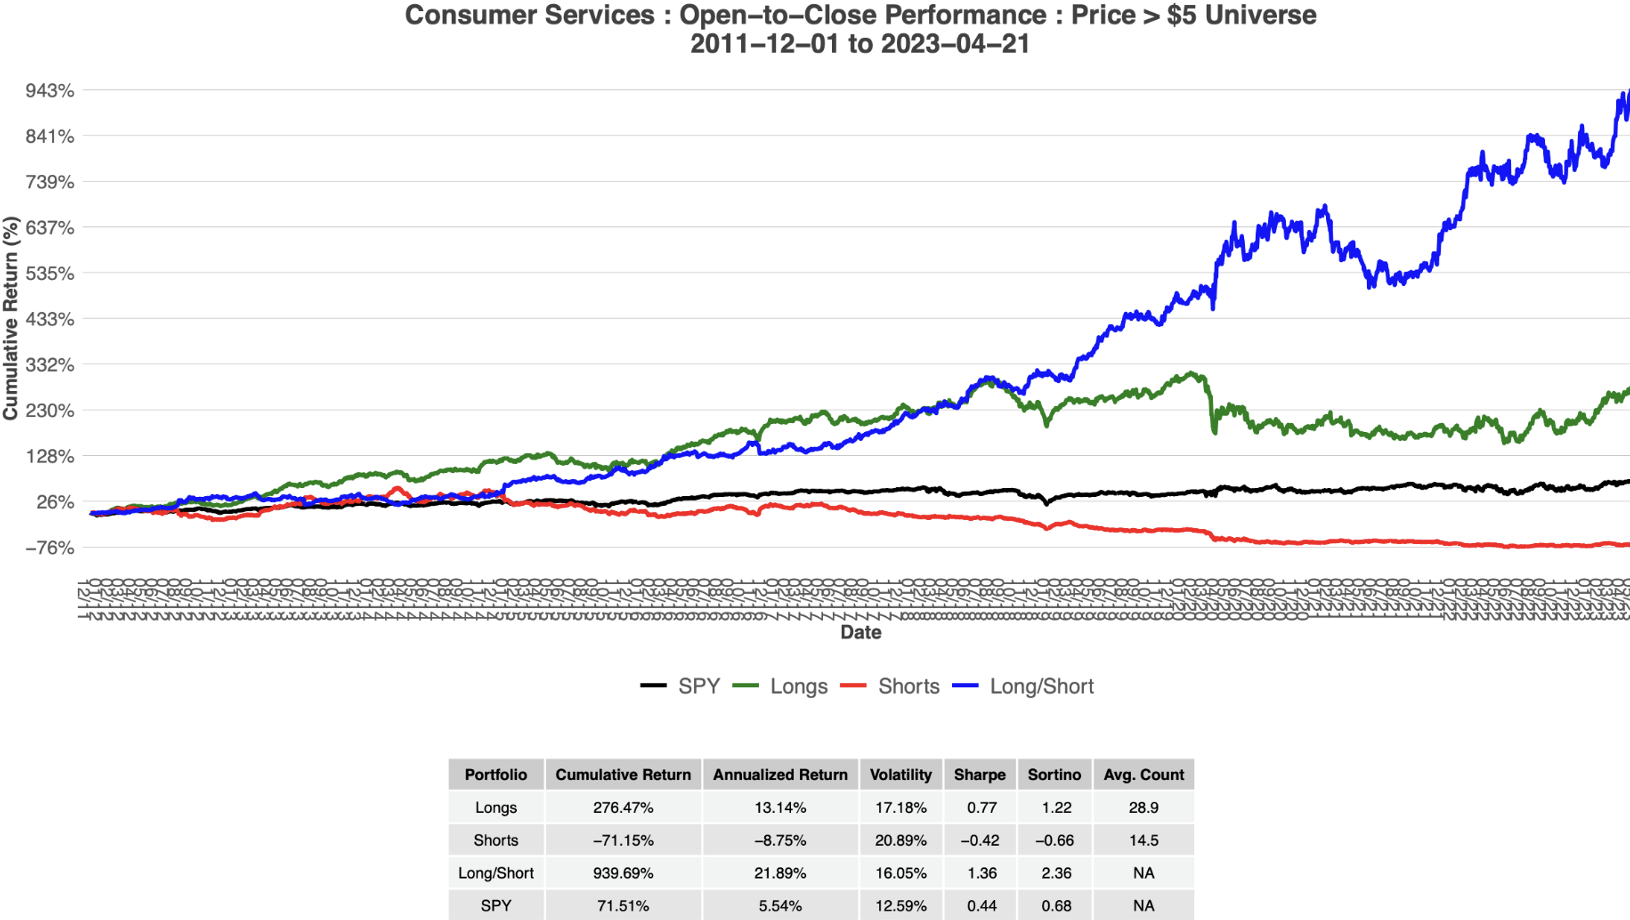
The green line is the portfolio S-Score > 2 and the red line is S-Score < -2. The blue line is an equally weighted Long/Short throughout the time series which performs exceptionally well. Each day there are on average 323.6 Consumer Services securities with Twitter conversations. Of those 323.6, on average there are 28.9 securities with extreme positive sentiment and 14.5 with extreme negative. This proportion is relatively consistent across sectors with ~8-10% of securities have extremely positive sentiment while ~3.5-5% have extremely negative sentiment.
Next is the sector with the highest average security price increase over the last 10+ years which is Technology. The technology sector has on average 271.6 securities mentioned on Twitter by accounts approved by Context Analytics.
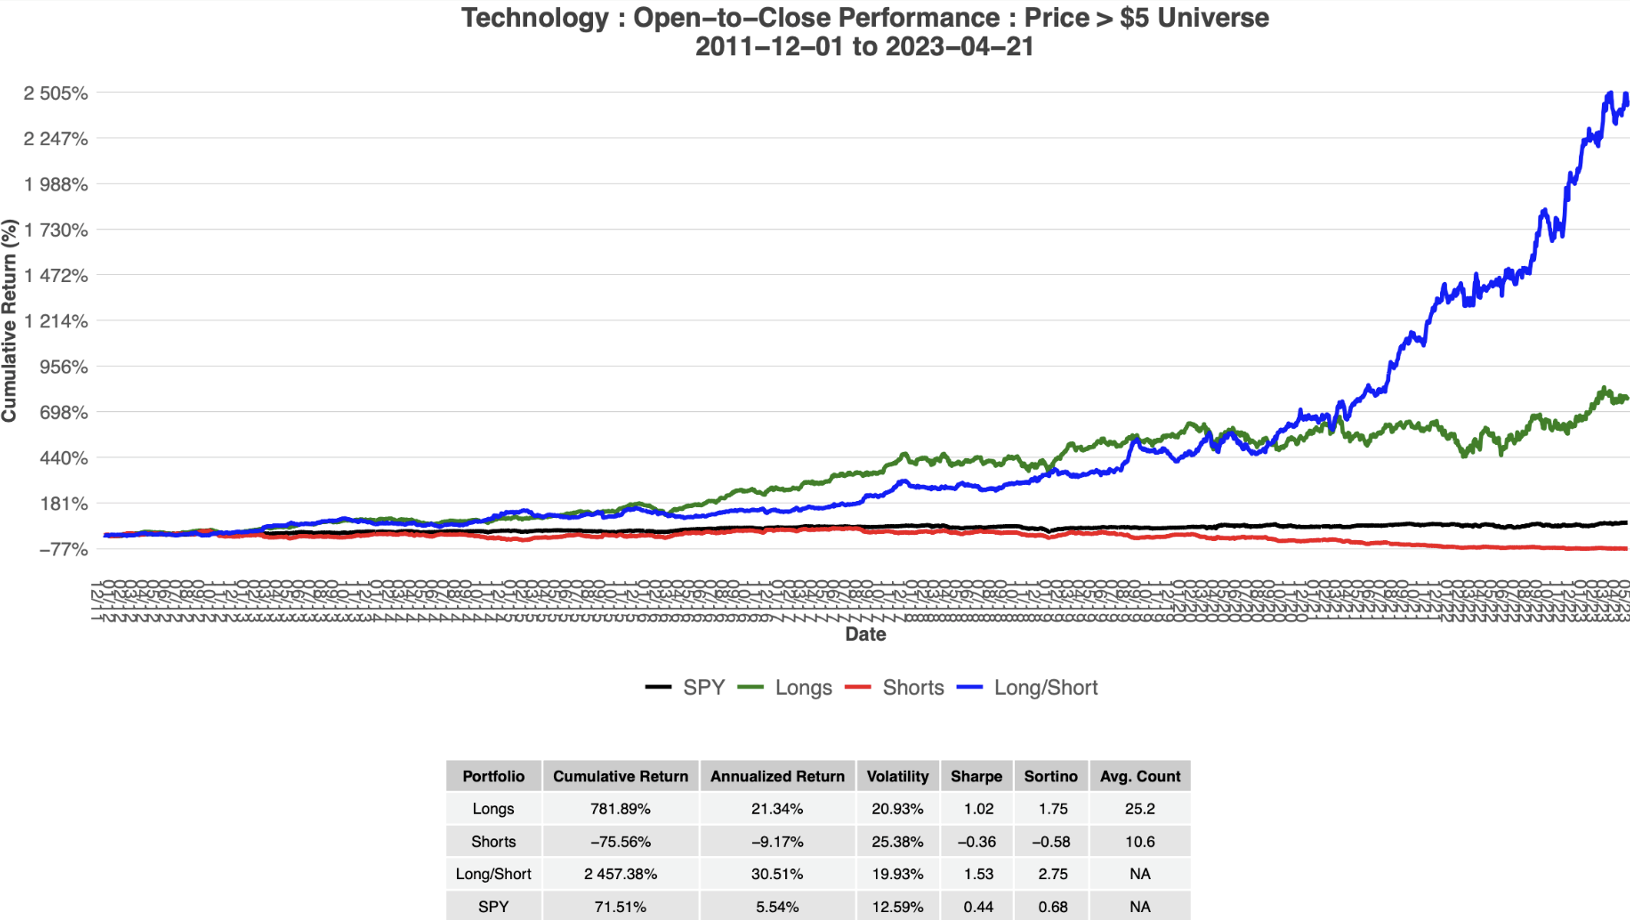
The performance of this sector has been remarkable over the 10-year history. These portfolios have on average 25.2 and 10.6 securities in the Long and Short portfolio, respectively. The Long/Short provides a great risk adjusted investment while also having the growth upside of the technology sector.
Social Media Sentiment has proven to be influential in financial markets and there are many other applications of using sentiment metrics to improve decision making. For more information, click the button below or email us at ContactUS@ContextAnalytics-AI.com.
