Context Analytics daily sentiment portfolio without overnight risk yields 75% return since the beginning of 2022, outperforming the S&P 500 which had a negative return over the same period.
With uncertainty in the market, people frequently ask us how social sentiment data is performing. Below is a chart that demonstrates the power of harvesting Twitter messages and converting them into quantitative factors. It shows the Open-to-Close return of common stocks with an S-Score > 2 or S-Score <-2 prior to Market Open. S-Scores are Z-Scores that detect Twitter sentiment. An S-Score > 2 means the conversation over the last 24 hours is 2 standard deviations more positive than it has been over the last 20 days. This is considered bullish for the stock price, and on the opposite end, a S-Score < -2 is considered bearish for the stock price. Only Tweets from our influential universe of Twitter accounts are aggregated into S-Scores every minute.
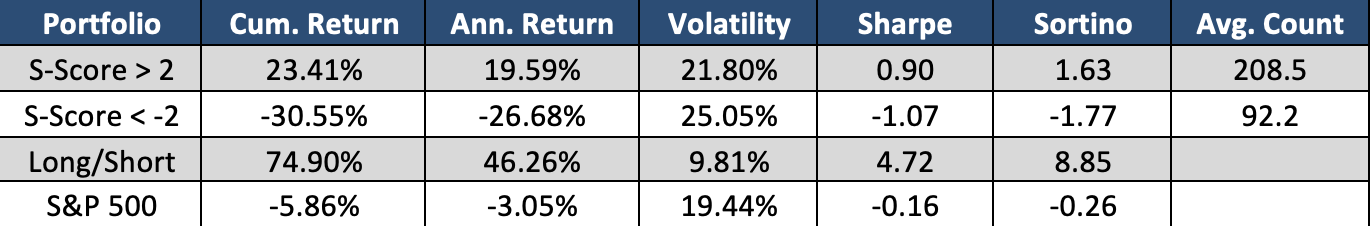
The green line above represents the subsequent Open-to-Close performance of stocks with and S-Score > 2 prior to market open. On average there were 208.5 securities in this portfolio each day. We added S&P 500 Open-to-Close return (Black Line) for comparison purposes. As you can see positive sentiment leads to an outperformance of the benchmark. The red line represents stocks with a S-Score < -2 prior to market open which was on average 92 securities each day. In this case, negative return for the red line represents positive alpha and a predictive signal. A theoretical Long/Short portfolio is represented by the blue line.
The steady portfolio returns from the Long/Short shows its risk-adverse nature which contributes to the 4.72 Sharpe ratio. Additionally, since each position is closed out at the end of the day, there is no risk during aftermarket hours. A return of nearly 75% over this time range is impressive considering the market’s performance. A Long Only portfolio using only securities with a S-Score > 2, outperforms the market by over 25%.
There are many other applications of using sentiment metrics to improve decision making in the stock market. For more information, click the button below or email us at ContactUS@ContextAnalytics-AI.com.