Changes in Risk Section of SEC Filings Impact Future Returns
Explore the predictive power of Context Analytics metrics derived from SEC filings.
For investors, staying informed about the financial health and performance of the companies they invest in is crucial. 10-K and 10-Q filings provide a comprehensive overview of a company's financial statements, business operations, risks, and opportunities. Manually analyzing these documents can be time-consuming and overwhelming. This is where Natural Language Processing (NLP) metrics from Context Analytics come in, they provide deeper insights from these lengthy textual documents.
Utilizing sentiment analysis and word count changes, investors gain a better understanding of a company's financial health and potential risks. This leads to more informed decisions and potentially higher returns. In this blog, we explore how Context Analytics' sentiment metrics can be used to analyze the risk section of 10-K and 10-Q filings. Risk sections outline various self-reported risks and uncertainties the company is facing or may face in the future. These risks can include changes in economic conditions, shifts in consumer behavior, changes in laws, and competition.
The focus of this research is on the size of the risk section and its subsequent effects on price. The metric used for this research is the Magnitude of Word Count Percentage Change. This metric identifies companies that make significant changes to their risk sections compared to companies with consistent risk sections. Investors rely on consistency and reliability in the information provided by companies. Therefore, significant changes in the risk section without clear explanations impact investor confidence.
A high number of changes in the risk section, particularly significant ones, can be worrisome and suggest various issues such as increased risk exposure, potential regulatory or legal problems, and a potential lack of communication.
These changes may indicate ongoing uncertainties which raise concerns for investors about the company's financial performance and overall prospects. The formula for calculating the Magnitude of Word Count Percentage Change is as follows, where i is an indicator for the most recent filing:

To test the effects of Magnitude Change, we conducted a backtest from the start of 2017 to May 2023. Returns were calculated by identifying the month the document was filed, mapping the date to the end of that month, and then determining the return for the subsequent 3 months or until a new filing is released. Portfolios are rebalanced monthly on the last market day of each month using the most recent data from their Annual or Quarterly report. We compared the returns for different portfolios of stocks based on their Magnitude Change. The comparison was made against the returns of the entire market universe with a stock price greater than $5. Initially, we implemented a strategy that encompassed every document in the universe. The documents were then divided into two strategies based on the Magnitude Change. With a median Magnitude Change of 3.2%, a cutoff number of 4% was identified as the threshold that resulted in the most equally sized strategies. By executing trades based on this strategy, the following results were obtained:

The time series graph clearly indicates that companies with lower magnitude changes tend to outperform the market, while those with higher magnitude changes tend to underperform in comparison. Specifically, when the magnitude change is less than the 4% threshold, it corresponds to an annual increase in returns of over 2% compared to the portfolio with a word count magnitude change exceeding the 4% threshold. Although the impact on returns is not significant, there is evidence to suggest that greater changes in the risk section can have negative effects on subsequent returns.
To further explore this effect, we conducted an analysis of more extreme values. We divided the companies into two buckets: those with a word count percentage magnitude change greater than 25% and those with a magnitude change less than 2.5%. This allowed us to examine the effects of these extreme changes over the same time range.

Based on the analysis of these extreme groups, the effects are further enhanced. While there is a modest improvement for companies with lower changes, there is a significant decrease in performance for those with a magnitude change greater than 25%. The annualized return drops by an additional percent, and the cumulative return is lowered by an additional 12%. Therefore, it becomes evident that while fewer changes in the risk section can marginally improve returns, more changes have predictive power in indicating worse performance in the market.
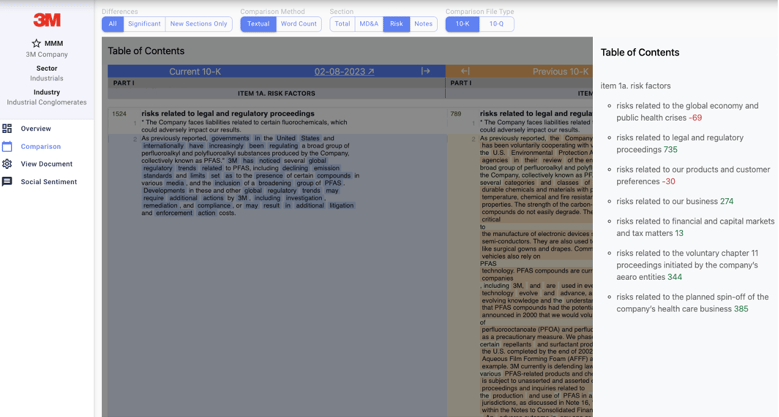
Using the Unstructured Data Terminal from Context Analytics, we can identify these risk section changes immediately. The dashboard allows for filtering on Word Count Change Percentage specifically in the risk section of 10-K and 10-Q filings. For example, we see that 3M Company on their February 2nd, 2023 10-K filing reported a 53% increase in the word count of their Risk section. Comparing this document’s new risk section to the previous file, we find that they added a large volume of words to “Risks Related to Legal and Regulatory Proceedings” and “Risks Related to our Business” sections. Also, new sections appeared named “Risks Related to the Voluntary Chapter 11 Proceedings Initiated by the Company’s Aearo Entities” and “Risks Related to the Planned Spin-off of the Company’s Health Care Business”.

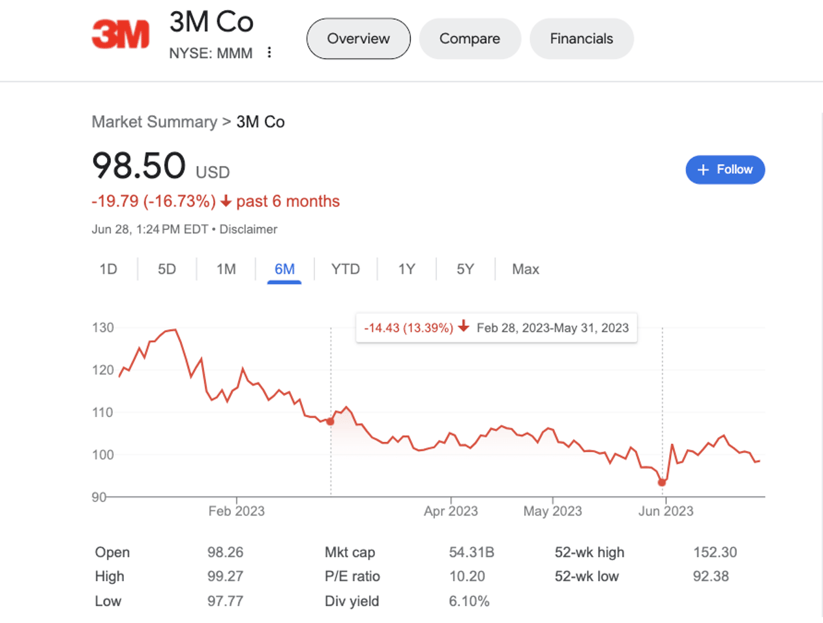
Consequently, from February 28th to the end of May (the time period the strategy calculates returns) their stock price dropped 13.39%.

While a specific example, this illustrates how Context Analytics’ analysis of the risk sections in 10-K and 10-Q filings can be used to gain deeper insights into risk sections and make more informed decisions. By examining the Magnitude of Word Count Percentage Change metric, investors can gain a deeper understanding of a company's potential risks. The research findings indicate that companies with fewer changes in their risk sections tend to outperform the market, while those with more changes underperform compared to the overall market. Consistency and reliability in the risk section information are crucial for investors, as significant changes without clear explanations can erode trust and confidence. By leveraging Context Analytics metrics and analyzing the risk sections of regulatory filings, risk assessors can mitigate risk and investors can potentially increase returns. For more information, click the button below or email us at ContactUS@ContextAnalytics-AI.com .

